150
k
Isograph
Isograph provides cutting-edge solutions in reliability engineering, specializing in the development of advanced software tools for safety, reliability, and risk analysis. Established in 1986 in the UK, the company initially offered consultancy and software development services focused on safety and reliability, particularly within the nuclear and aerospace sectors. Soon after, Isograph expanded to create and support a comprehensive range of 'off-the-shelf' reliability products. With offices in both the UK and the USA, Isograph now offers a world-leading suite of integrated reliability software tools, supported by 20 agents globally who provide product supply and first-line support. The company boasts over 9,000 installations worldwide.
Isograph Softwares
Reliability Prediction
Introduction:
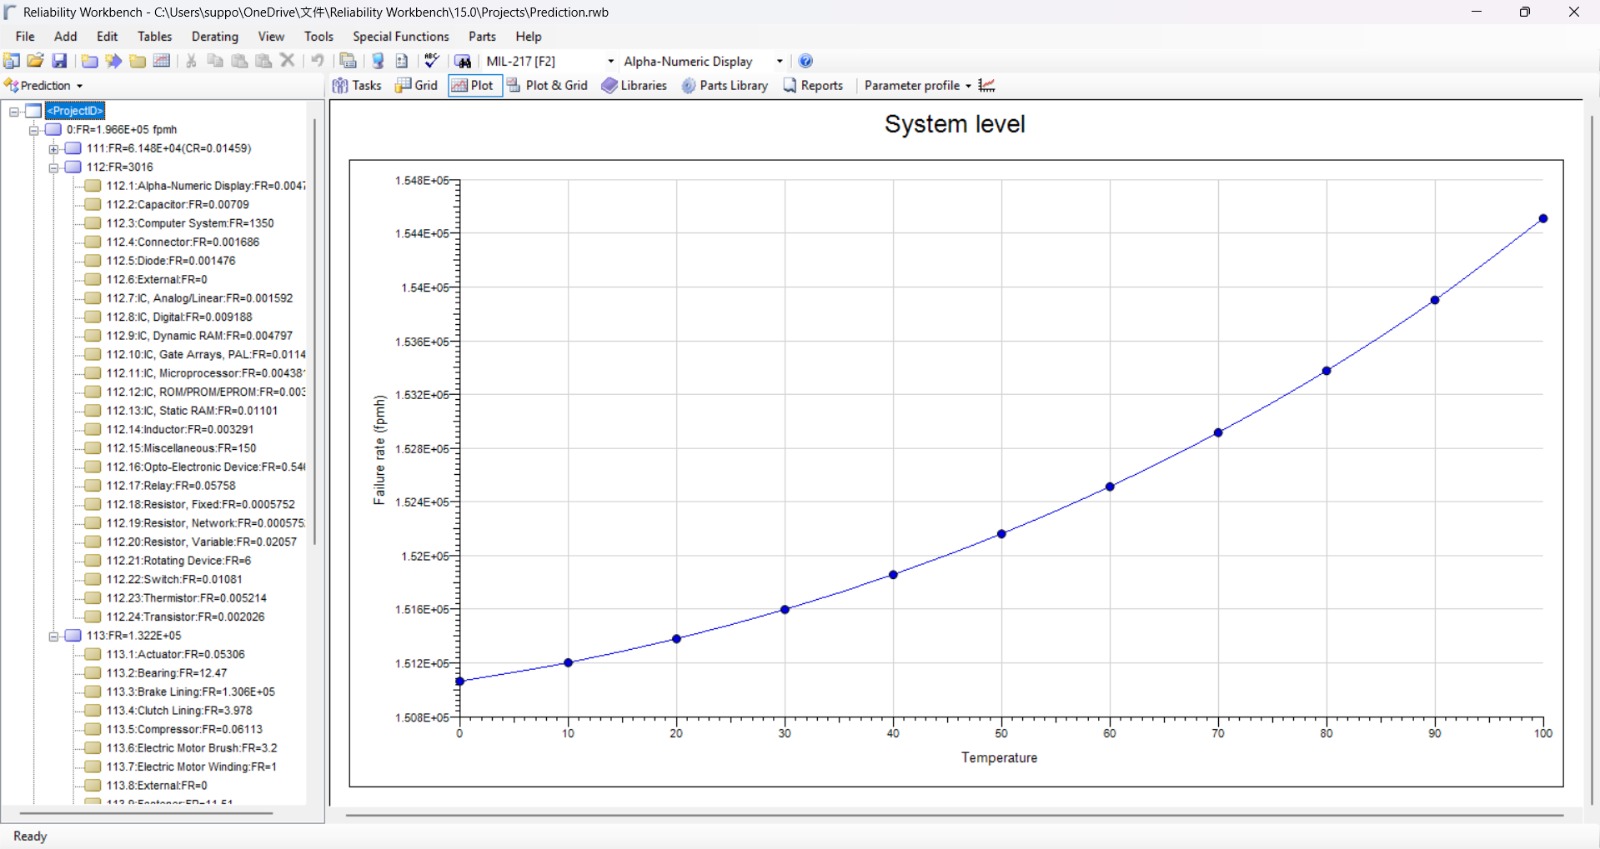
- The reliability prediction module of Reliability Workbench enables you to predict failure rates for a set of components under given operational and environmental conditions.
- These failure rate calculations as defined by the standard and provides with the results like overall component and system failure rate.
Prediction Standards:
The Reliability Workbench Prediction module includes the following standards:
- Telcordia SR-332 Issues 2 and 3
- MIL-HDBK-217
- MIL-HDBK 217 Plus
- IEC TR 62380 (RDF 2000)
- NSWC handbook
- GJB/z 299B and 299C
- Siemens SN 29500/IEC 61709 Predictions
- FIDES
Benefits:
- Able to define the components in the system in a tree structure
- Able to predict the failure rate of the components and system failure rate using the standards.
- The contributions of components failure rates to blocks and systems failure rates can be easily displayed.
- The effects of stresses caused by the various environmental conditions can be examined.
- Components can be predicted in phased manner by using the various temperature conditions.
- The overstressed components can be evaluated from the derating analysis of the components. The derating analysis can be performed using defined standards.
- A powerful graphing facility can display the variation of predicted failure rates with ambient temperature, stress and environment settings for an entire system or individual blocks and components.
- Able to plot the parameter profile, mission profile and block profile.
- Able to do the derating.
- The maintainability tasks can be easily attached to the components.
- Commonly used components can be entered once in a library and then pulled into the project tree each time when the component is used.
- Information can be imported from XML, Excel, Clipboard, Access, SQL Server, Oracle and other formats.
- Powerful reporting features allow you to create professional standard reports at the click of a button.
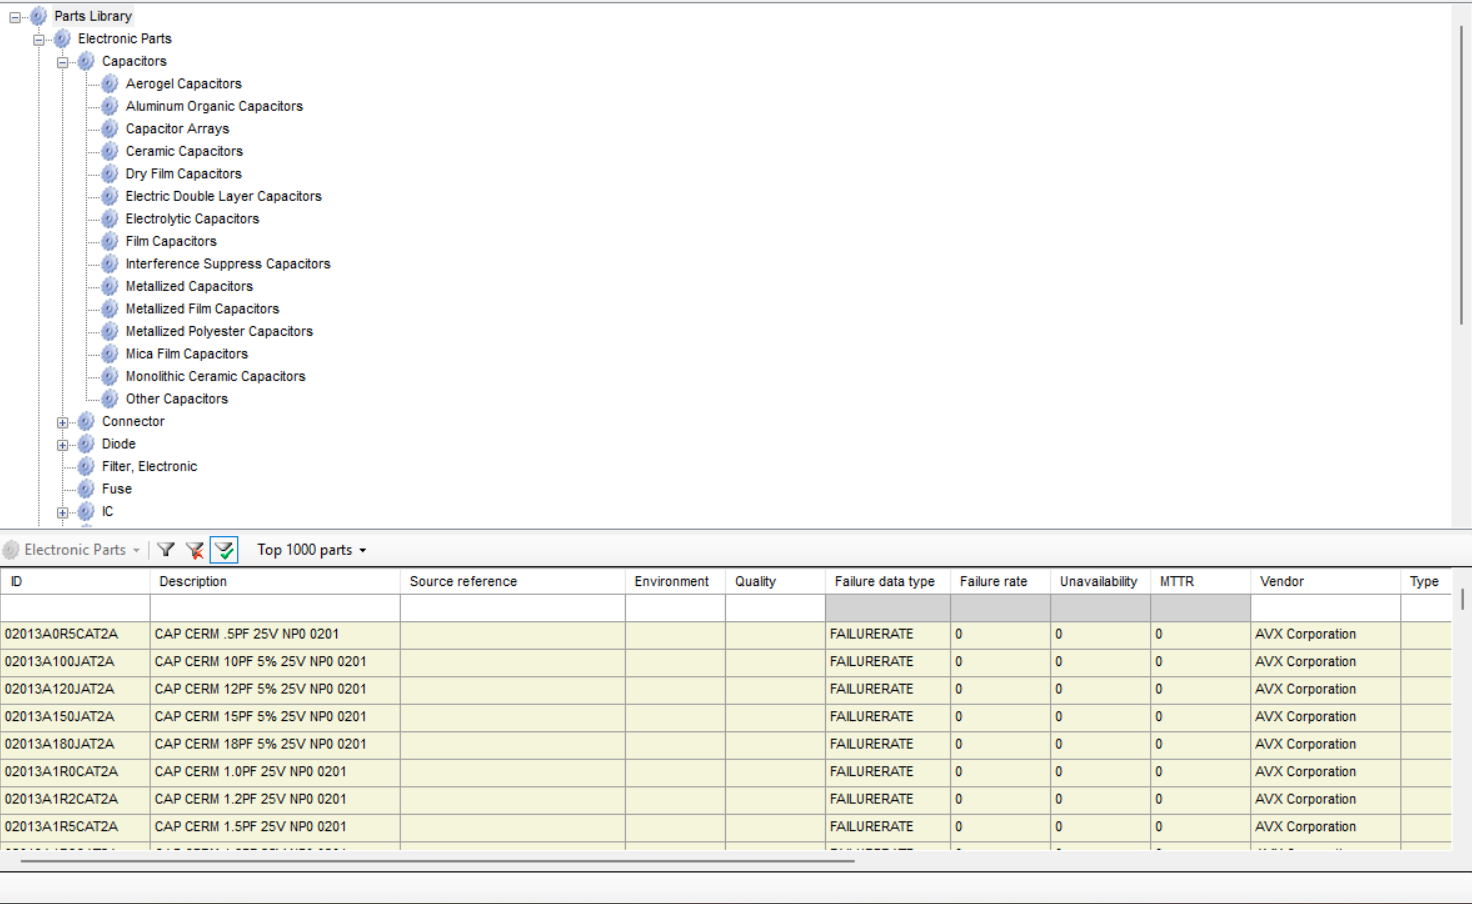
Part Libraries
Introduction:
- The reliability prediction module of Reliability Workbench enables you to predict failure rates for a set of components under given operational and environmental conditions.
- These failure rate calculations as defined by the standard and provides with the results like overall component and system failure rate.
Prediction Standards:
The Reliability Workbench Prediction module includes the following standards:
- Telcordia SR-332 Issues 2 and 3
- MIL-HDBK-217
- MIL-HDBK 217 Plus
- IEC TR 62380 (RDF 2000)
- NSWC handbook
- GJB/z 299B and 299C
- Siemens SN 29500/IEC 61709 Predictions
- FIDES
Benefits:
- Able to define the components in the system in a tree structure
- Able to predict the failure rate of the components and system failure rate using the standards.
- The contributions of components failure rates to blocks and systems failure rates can be easily displayed.
- The effects of stresses caused by the various environmental conditions can be examined.
- Components can be predicted in phased manner by using the various temperature conditions.
- The overstressed components can be evaluated from the derating analysis of the components. The derating analysis can be performed using defined standards.
- A powerful graphing facility can display the variation of predicted failure rates with ambient temperature, stress and environment settings for an entire system or individual blocks and components.
- Able to plot the parameter profile, mission profile and block profile.
- Able to do the derating.
- The maintainability tasks can be easily attached to the components.
- Commonly used components can be entered once in a library and then pulled into the project tree each time when the component is used.
- Information can be imported from XML, Excel, Clipboard, Access, SQL Server, Oracle and other formats.
- Powerful reporting features allow you to create professional standard reports at the click of a button.
Reliability Block Diagram (RBD)
Introduction:
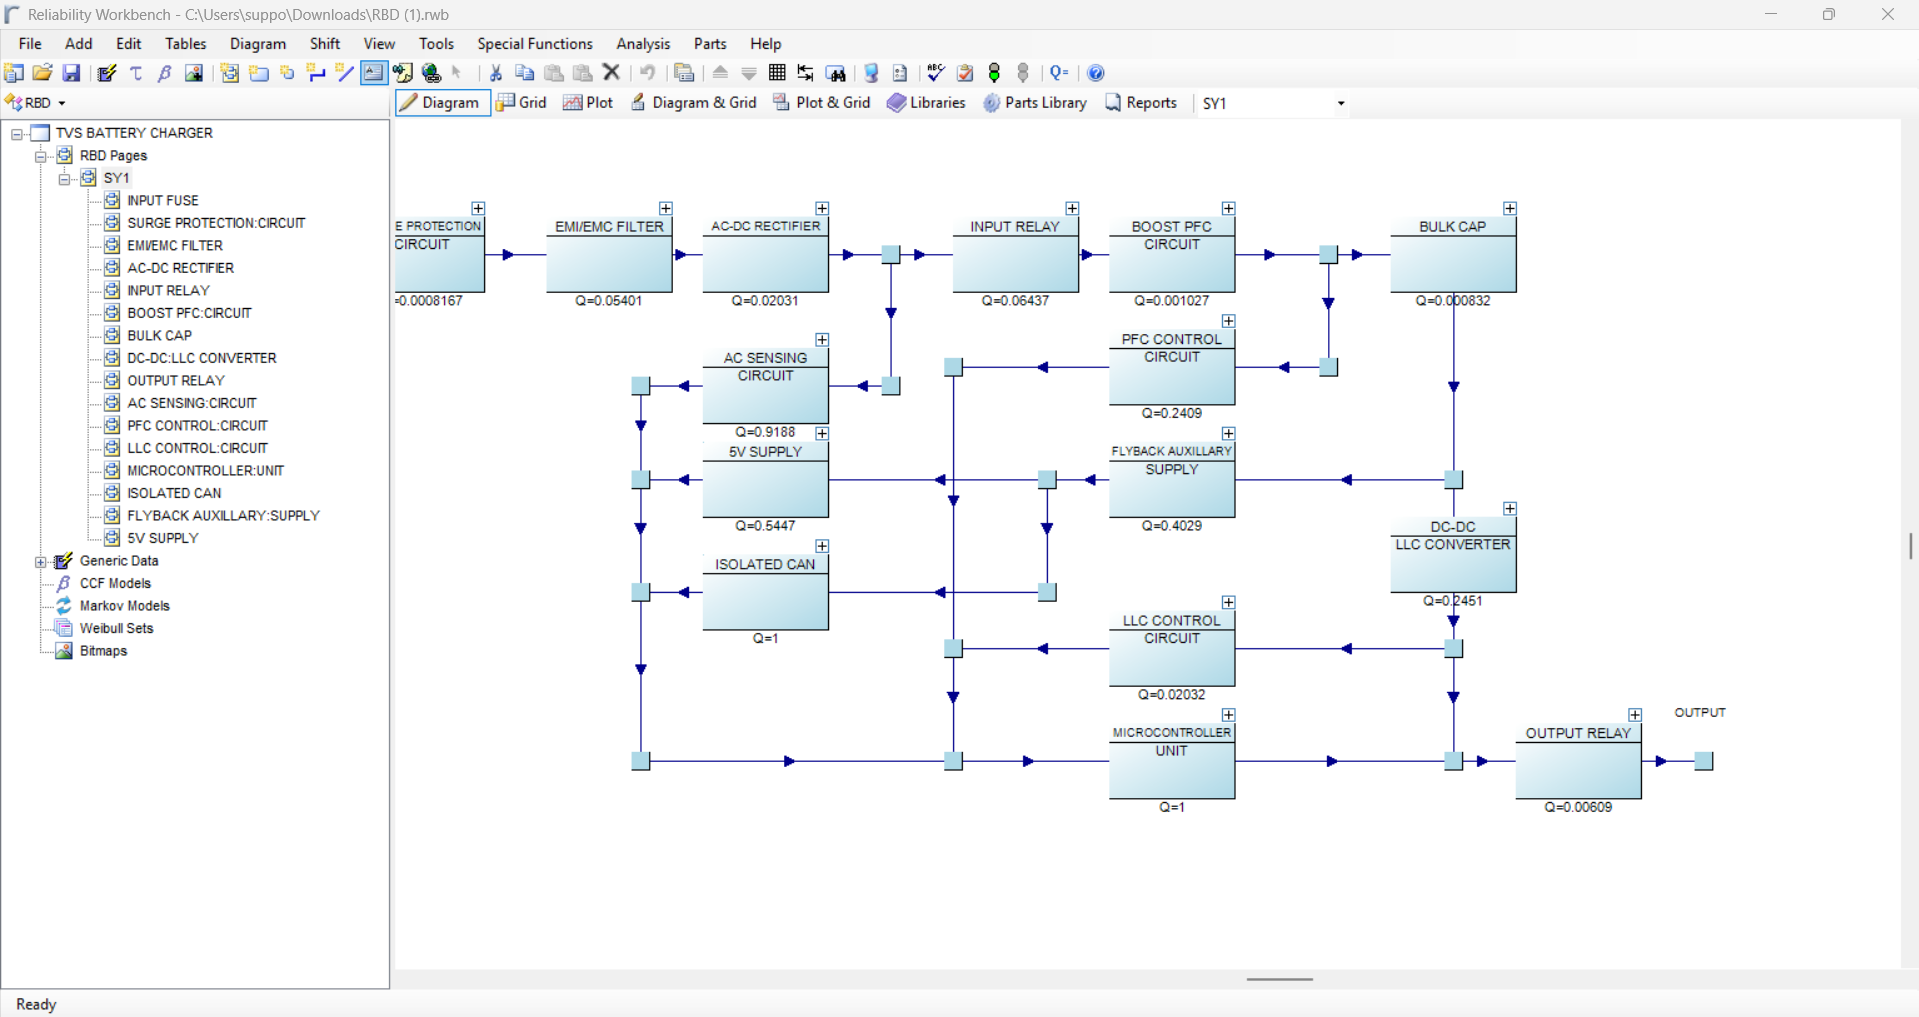
A Reliability Block Diagram (RBD) is a graphical representation used in reliability engineering to model and analyze the reliability of a system. It shows the components of a system and their relationships in terms of reliability, helping engineers understand how component failures can impact the overall system. The diagram is a key tool used for calculating system reliability, availability, and performance in a structured manner.
- A Reliability Block Diagram (RBD) is a method of modelling how components and sub-system failures combine to cause system failure.
- Reliability block diagrams may be analyzed to predict the reliability and availability of a system.
- Able to determine the critical components from a reliability viewpoint.
Key Features:
- Reliability Workbench RBD is also provided with Markov analysis and Weibull analysis modules.
- Able to select the part libraries for reliability estimation.
- Capable of analyzing large and complex RBD.
- Able to produce the minimal cut- sets for both the sub system and system.
- Able to calculate a range of importance measures.
- Provides unlimited hierarchical levels for the project.
- Includes a Common Cause Failure (CCF) facility.
- RBD can be do the time dependent analysis as per requirement.
- N out of M redundancies problem can be solved.
- Produces high quality RBD reports.
- Import and export facilities allow data to be transferred to and from the data bases, spreadsheets and files.
Benefits:
- Provides the parameters like Reliability, Availability and Expected failures.
- Markov analysis capabilities are provided for analyzing components with strong dependencies.
- Weibull analysis is included to predict the age of the component using the historical data sets.
- Able to identify the weak areas in the system
- Able to recommend for the design changes according to the reliability aspects.
- The multiple import and export facilities are provided.
- The report designer is very useful to maintain all the reports in a folder.
FMECA
Introduction:
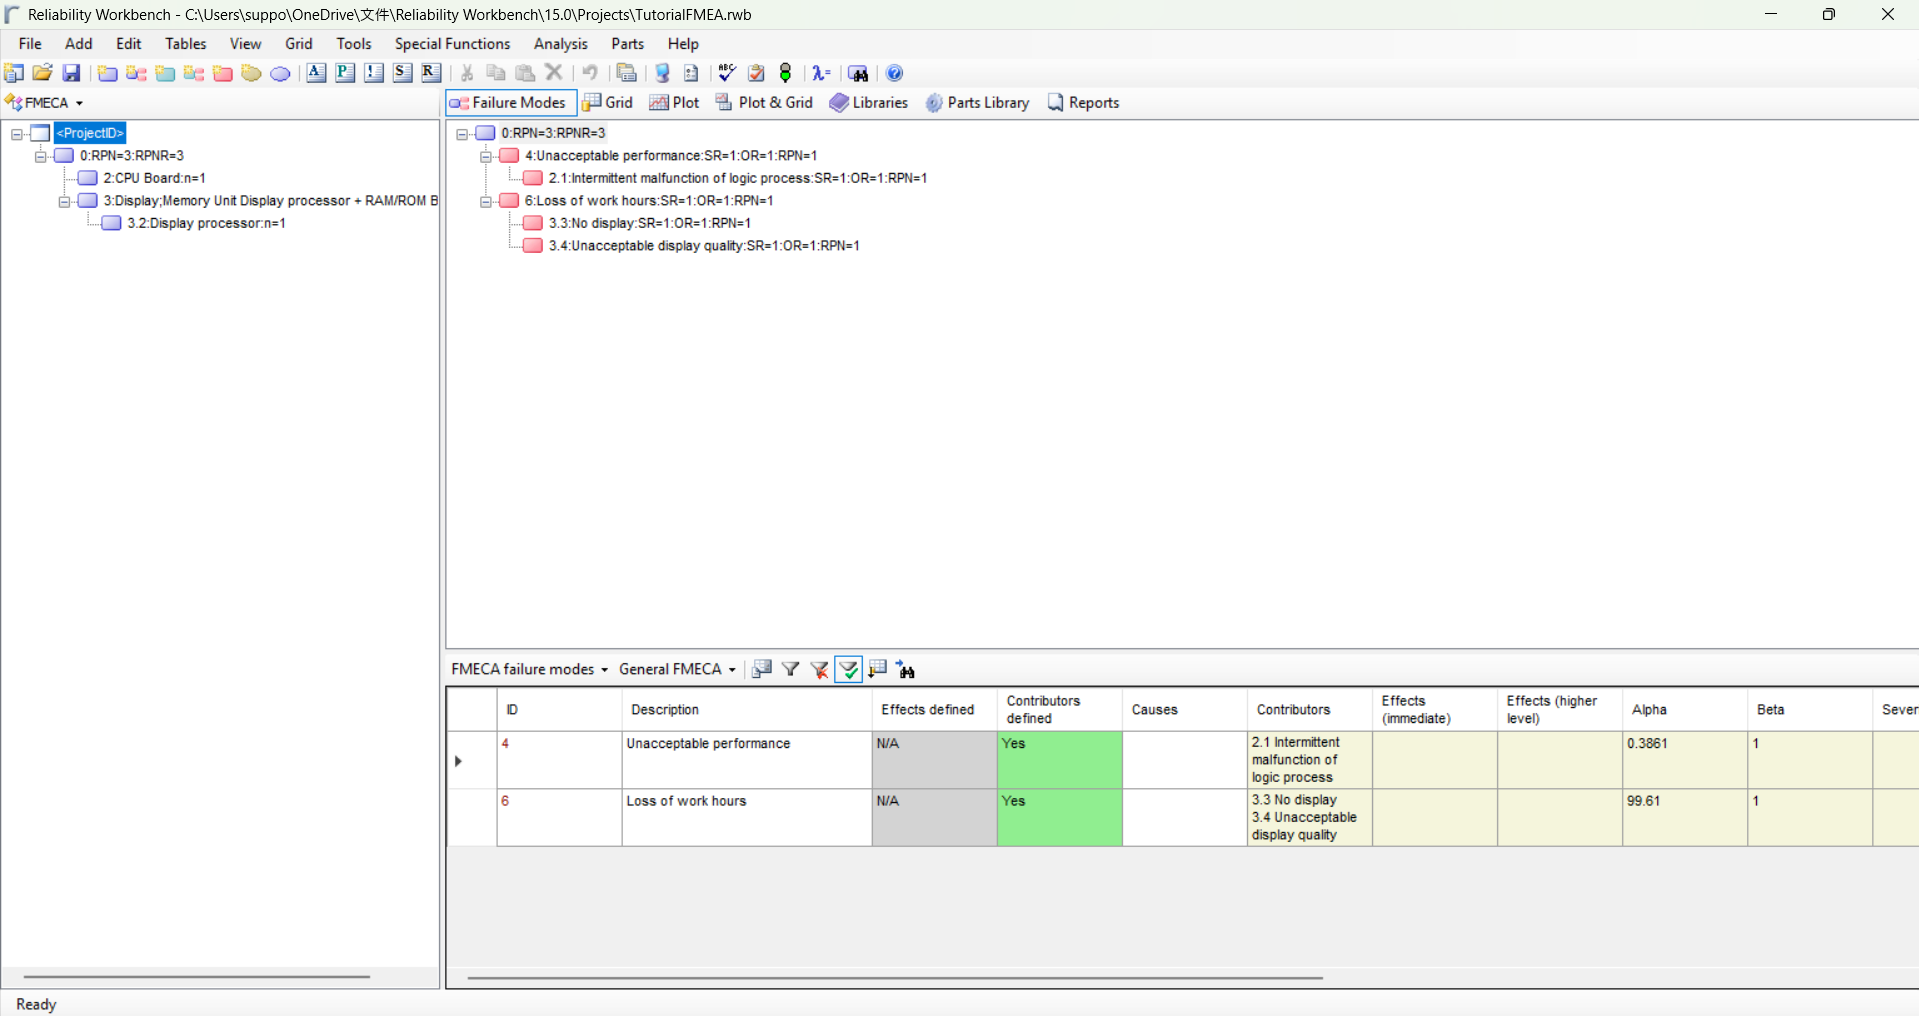
- A Failure Mode, Effects and Criticality Analysis (FMECA) Module is a used for identifying potential failure modes in a system and classifying them according to their severity values.
- A FMECA is usually carried out progressively:
- Identifying failure modes and their effects (Failure Mode and Effects Analysis- FMEA).
- Identifying the Risk Priority number (RPN) which is based on the multiplication of occurrence of failures, severity of failure and detection of failure for FMEA.
- Hazard Assessment can be done through the FMECA module using FMEA or FMECA model.
- Failure Modes Effects and Diagnostic Analysis (FMEDA) can be done using FMECA module. ISO 26262 and IEC 61508 safety standards can also be implemented in it.
- Able to SIL calculation using IEC 61508 standard.
- Able to use the MIL-1629 standards for FMECA.
- Ranking failure modes using their effects according to the combination of severity and the probability of that failure mode occurring (Criticality Analysis - FMECA).
Key Features:
Our Reliability Workbench FMECA and Fault Tree+ modules have been tested and certified by SGS-TÜV as suitable for safety analyses according to ISO26262.
Some of the FMEA Software features are summarized below:
- Creation of Apportionment library and Phrase library for fast data entry
- Effects of the failure modes can be automatically traced through to system level
- Automatically severities can be assigned and there will be automatic criticality calculations
- Multiple failure effects permitted for a single failure mode
- Failure detection filter facility and User-definable severity category libraries
- Spelling checker and global text replacement for the easy convenience
- Sub-projects may be linked to a master project
- Automatic data transfer from prediction modules
- Drag and drop components to the RBD module
- Automatic fault tree construction facility
Benefits:
- The FMECA module allows the customers to construct the FMEA and FMECA in the required standards.
- The FMECA Module is its ability to automatically trace failure effects, severity values and failure causes through the system hierarchy.
- Failure rate and criticality values are automatically calculated by the program.
- Able to plot the criticality matrix (severity classification vs criticality), contribution plot (Failure mode vs Failure rate) and RPN plot.
- The FMECA Software Module will also filter detectable and non-detectable failures in reports
- Able to determine the ratio between the frequency of detectable failures and total failures.
- Apportionment libraries and Phrase libraries make an added advantage to FMECA building in the software.
- Automatic conversion from FMECA module to RBD, Fault Tree, Allocation.
- Import and Export can be done easily.
Fault Tree+
Introduction:
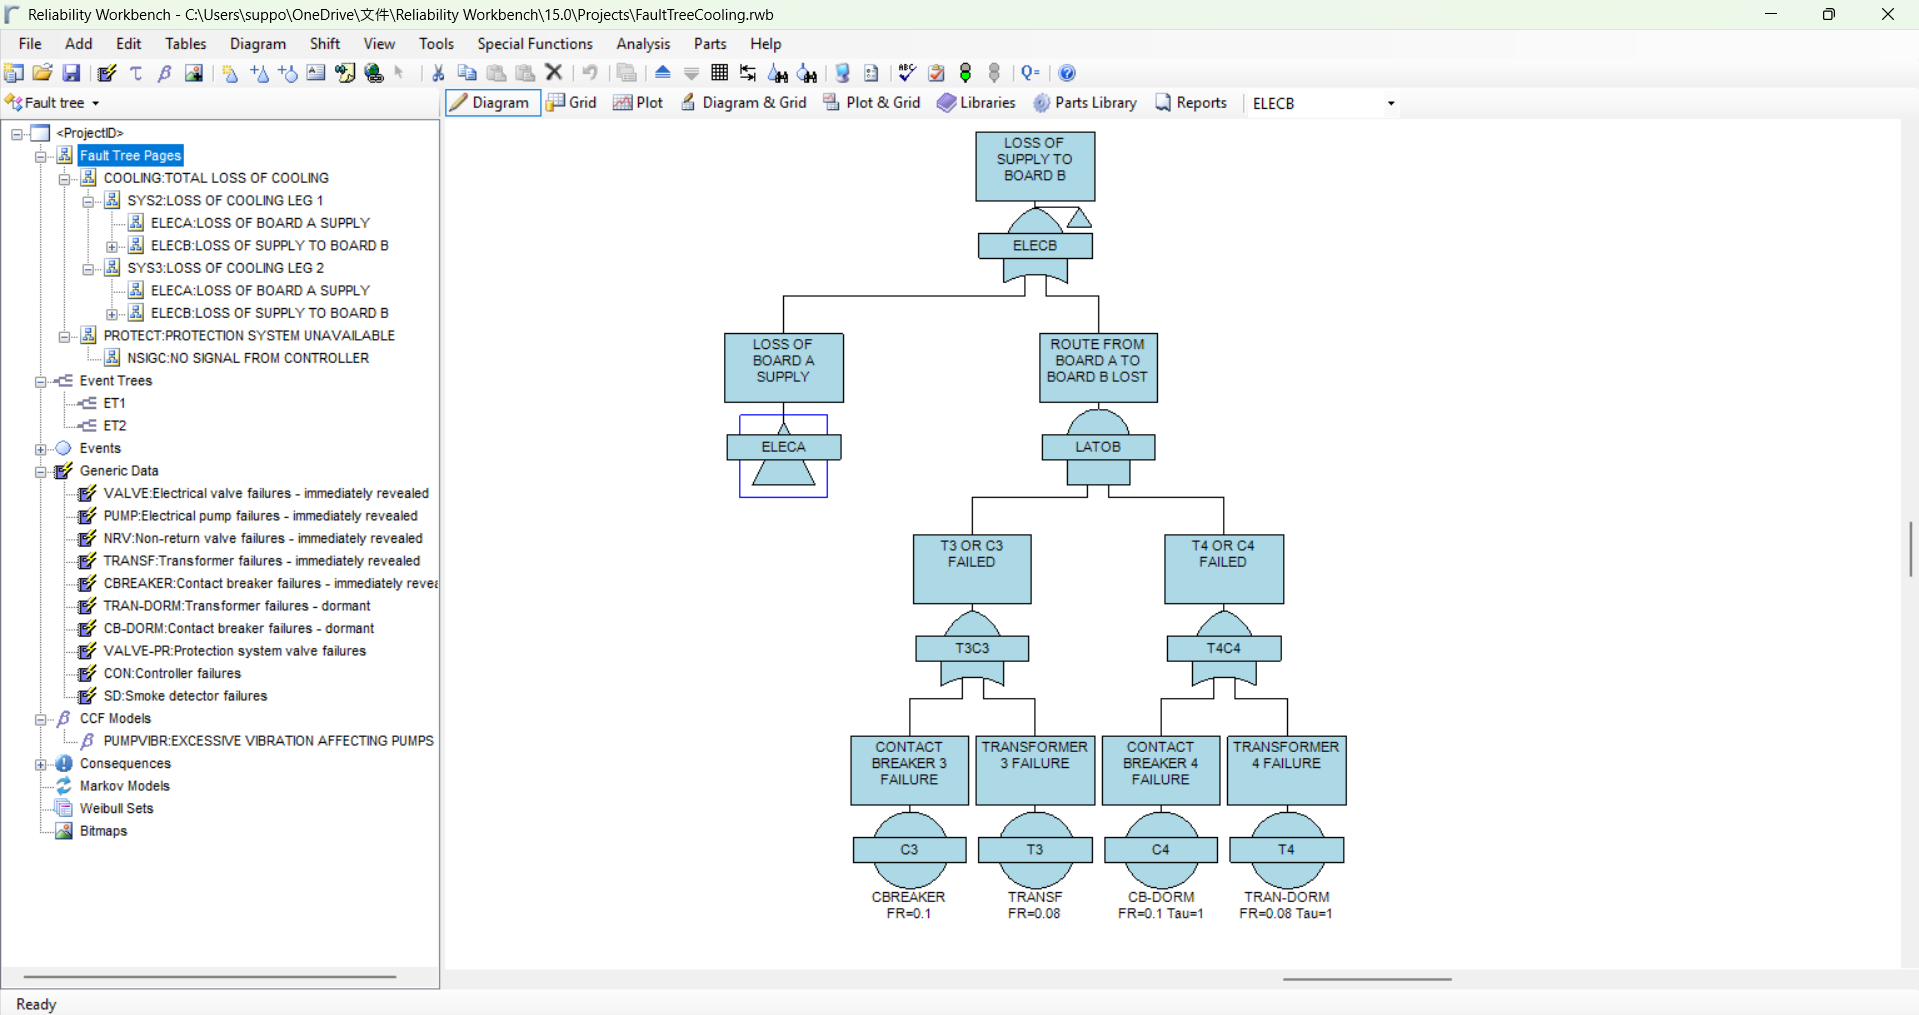
A fault tree represents the causes of a specified system failure mode in terms of the failure modes of the system components. The analysis of the fault tree can produce two types of result: qualitative and quantitative. Qualitative results specify the minimal combinations of component failures which result in system failure. Quantification provides the probability or frequency of the system failure mode.
Fault Tree Analysis (FTA) is an analytical technique, whereby an undesired state of a system (called top event) is specified, usually a state that is critical from a safety or reliability standpoint.
Fault tree diagrams represent the logical relationship between sub-system and component failures and how they combine to cause system failures.
Fault Tree+ has the ability to cover the hazard and safety aspects, historical data analysis, state dependency of the components through the inclusion of Fault Tree, Event Tree, Weibull analysis, and Markov analysis. FT+ can also be used the part libraries.
Key Features:
Isograph has built its reputation on the efficiency, accuracy, stability and ruggedness of its Fault Tree+ product.
The Reliability Workbench Fault Tree+ (and FMECA) modules have been tested and certified by SGS-TÜV as suitable for safety analyses according to ISO 26262.
- Range of event failure and repair models
- Failure models range from fixed rates, dormant, sequential, standby, time at risk, binomial, Poisson and initiator failure models. More than 15 failure models can be used for analysis of FT can be used in FT+.
- Basic events may be linked to Markov models created in the Markov analysis module.
- CCF analysis using the beta factor, MGL, alpha factor or beta BFR methods.
- Initiator-enabler analysis for sequence dependent analyses.
- Sensitivity analysis allowing the automatic variation of event failure and repair data between specified limits.
- Time dependent analysis providing intermediate values for time dependent system parameters.
- Fault tree house event analysis. Full minimal cut set analysis (including success states if required)
- Post-processing facilities for accurate upper bound calculations. Importance analysis.
- Risk measures provided for event tree consequences.
- Uncertainty analyses allowing confidence levels to be determined from event failure and repair data uncertainties.
- Previously developed FT can be used in new FT from attach library and it can save lot of time.
- Special Functions tool has a capability to change the FT in in different modules as well as it can change gate into events and vice versa.
- Schematic diagram can be included on the FT+ page for more understanding.
Benefits:
- Fault Tree+ Module able to build the large fault trees close to real world scenario. Transfer in and out tool helps it to make complex scenario easily.
- Fault tree module is associated with event tree, Markov analysis, Weibull analysis in order to evaluate the hazardous events in every respect.
- It provides CCF analysis, importance analysis, and uncertainty analysis and sensitivity analysis facilities.
- It uses efficient minimal cut set generation algorithms to analyze large and complex fault and event trees.
- NOT logic may be included in the fault and event trees at any level and event success states retained in the analysis results as an option.The comprehensive reporting facilities are also included, allowing the user to report on their results using sophisticated text, graph and diagram reports.
- Data Link manager can easily link data from any modules to FT+.
Event Tree
Introduction:
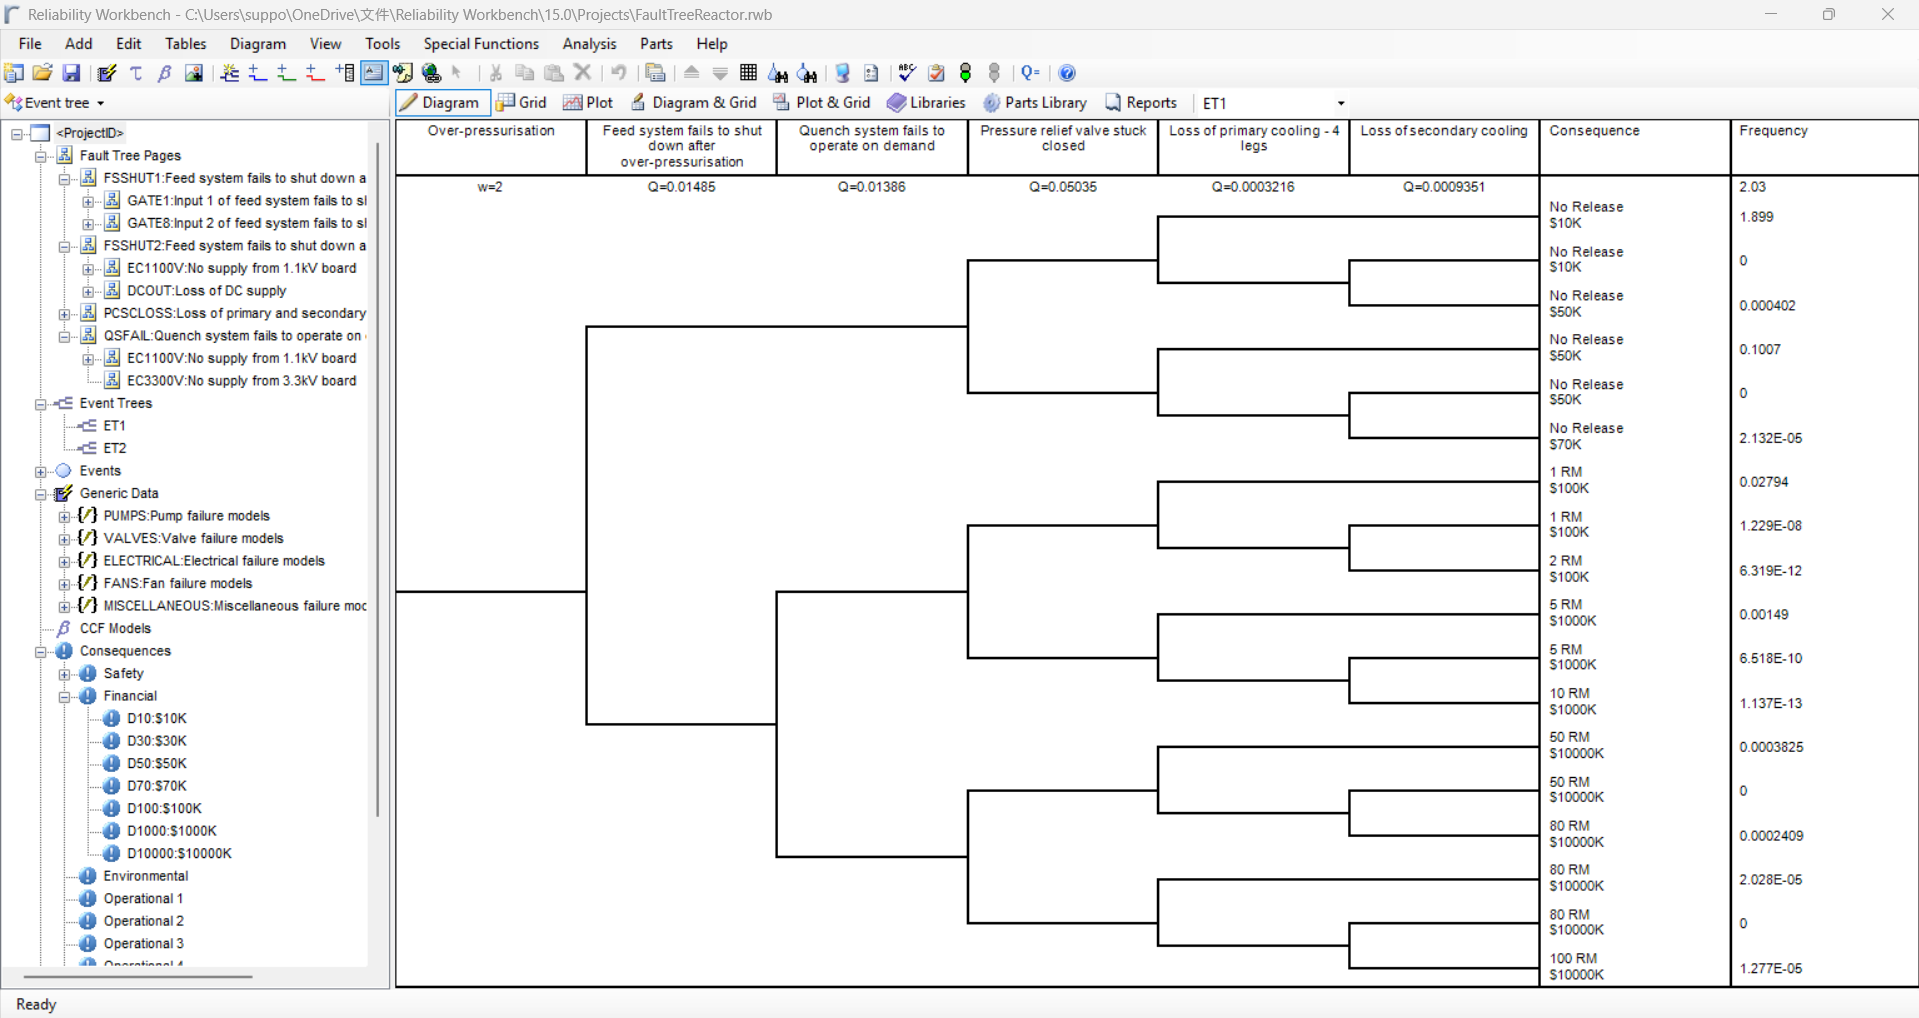
Event Tree Analysis (ETA) is a method that examines the consequences of a particular event. Starting from an initial event, the tree is divided into two branches, whereby the upper one represents a positive and the lower one a negative development (event trees are usually drawn from left to right). Repeated branching of the tree shows possible effects of an initial event on a system. The aim of ETA is the identification of possible damage events.
Event trees allow you to analyze the possible outcomes of an event occurring.The event tree model may be created independently of the fault tree model or may use fault tree analysis gate results as the source of event tree probabilities.
Key Features:
- Event Tree is included along the Fault Tree module.
- Full minimal cut set analysis. Success states are fully handled.
- Range of event failure and repair models including fixed rates, dormant, sequential, standby, time at risk, binomial, Poisson and initiator failure models
- Basic events may be linked to Markov models created in the Markov analysis module
- Comprehensive risk calculation.
- Risk importance analysis identifying the major contributors to risk
- Sensitivity analysis allowing the automatic variation of event failure and repair data between specified limits
Benefits:
- The event tree module handles both primary and secondary event trees, multiple branches and multiple consequence categories.
- Fault tree analysis gate results as the source of event tree probabilities can be used.
- Large and complex event tree can be easily evaluated.
Markov Analysis
Introduction:
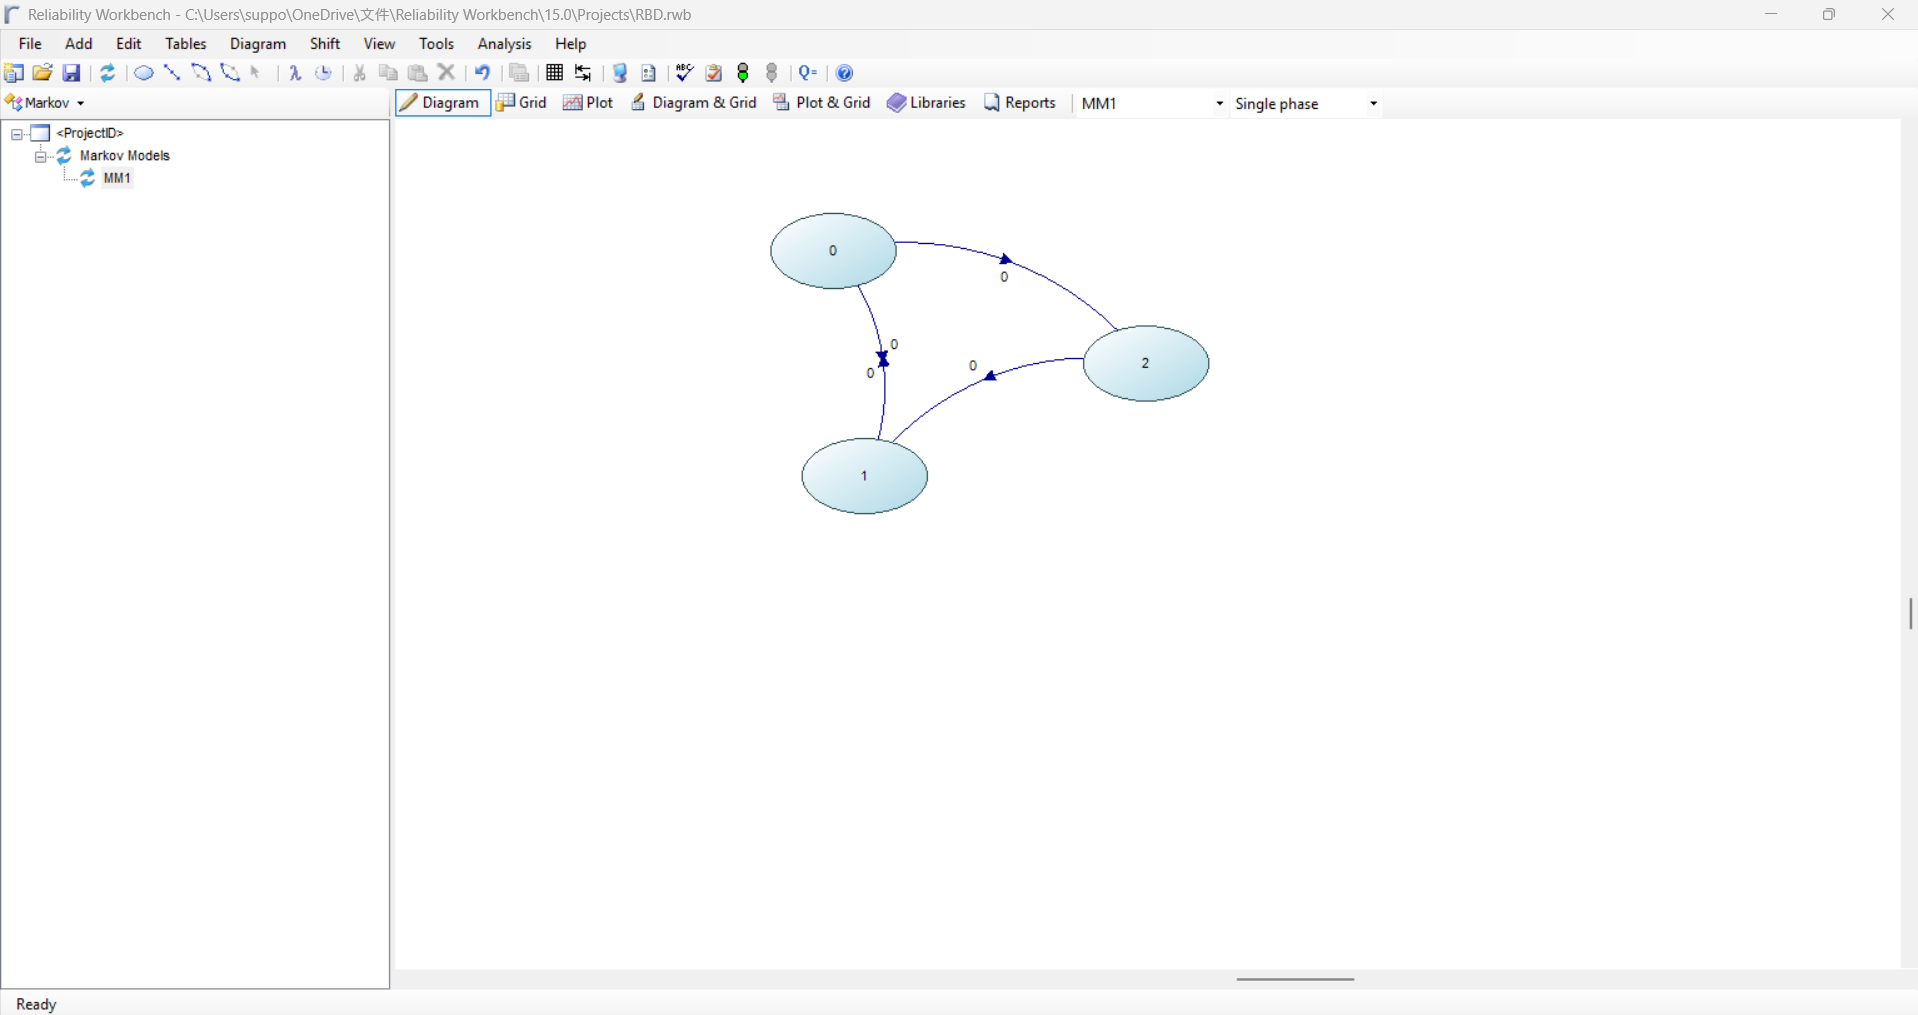
Markov analysis module models systems which exhibit strong dependencies between component failures.
It is very flexible in the type of systems and system behaviour it can model. This modelling technique is very helpful in most of the situations.
The model is quite useful to modelling operation system with dependent failure and repair models. In fact, it is widely used to perform Reliability and Availability analysis of responsible system with constant failure and repair rates.
Key Features:
- Graphically constructed transition diagram
- Division of analysis into separate phases State attribute editing via easy-to-use dialogs
- Data verification for consistency checks
- Time-dependent transition rates modelled
- Global parameter facility for repetitive data
- Calculation of a wide range of probabilities and frequencies
- Graphs and plots showing time-dependent results
Benefits:
- Markov analysis is included along with Reliability Block Diagram (RBD) and Fault Tree+ modules.
- The Markov module provides a visual interface to construct the state transition diagram and then uses numerical integration to solve the problem.
- The state transition diagram represents the discrete states of the system and the possible transitions between those states.
Weibull Analysis
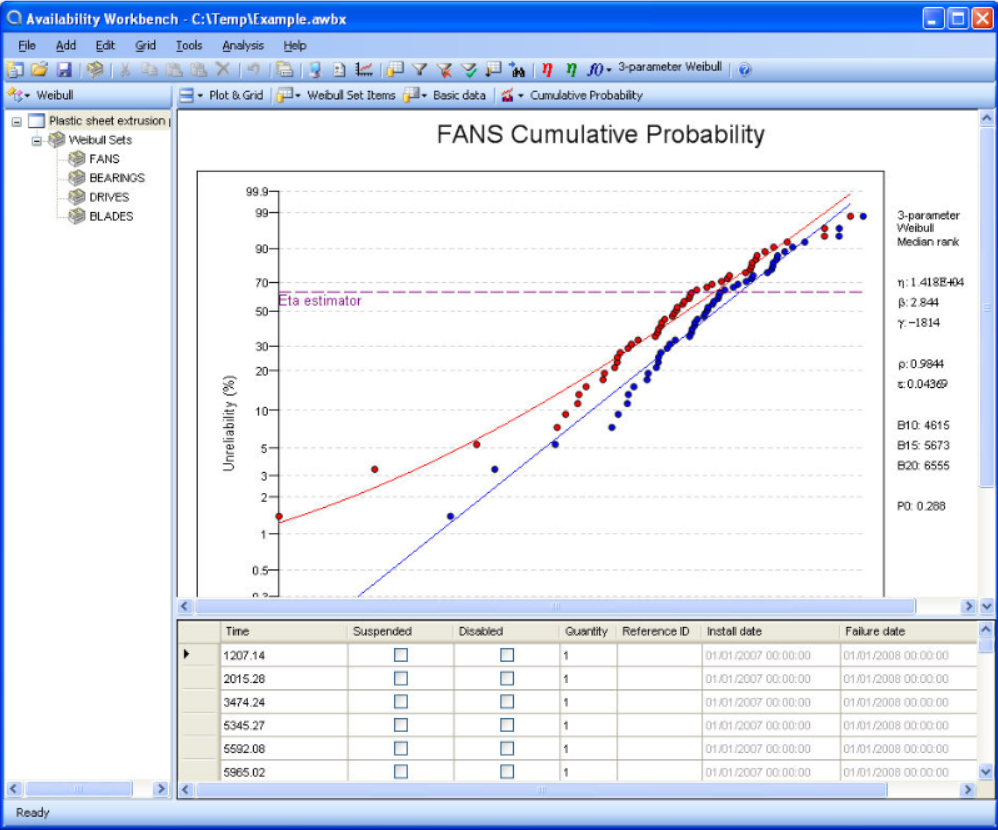
Introduction:
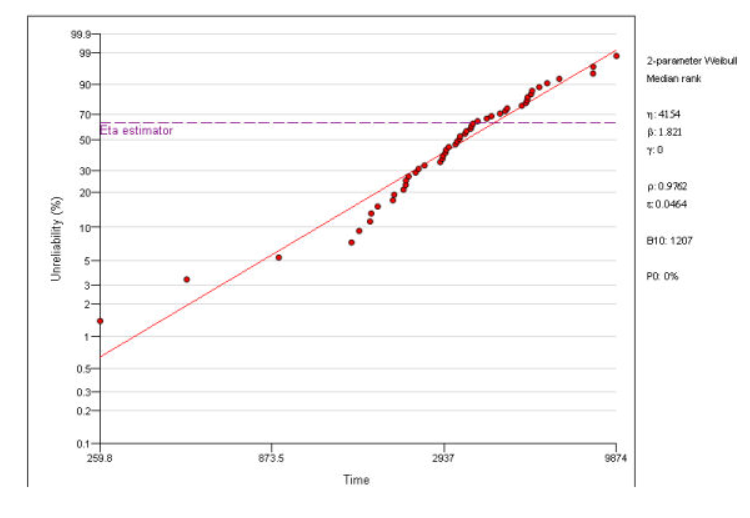
- The Weibull Analysis module analyses historical failure and repair data by assigning probability distributions.
- The failure distribution assigned to a given set of times to failure (known as a Weibull set) may be assigned to basic events or generic failure models in the Fault Tree Analysis module and to reliability blocks or generic failure models in the RBD analysis.
Available Distributions:
The Weibull Analysis Module analyses times-to-failure and time-to-repair data using the following distributions:
- Exponential Distribution
- 1-Parameter Weibull Distribution
- 2-Parameter Weibull Distribution
- 3-Parameter Weibull Distribution
- Weibayes
Benefits:
- Included with Reliability Block Diagram (RBD) and Fault Tree modules.
- The Weibull module automatically fits the selected distribution to the data provided.
- Displays the results graphically in the form of cumulative probability plots, unconditional probability density plots and conditional probability density plots.
- Module is very easy to use.
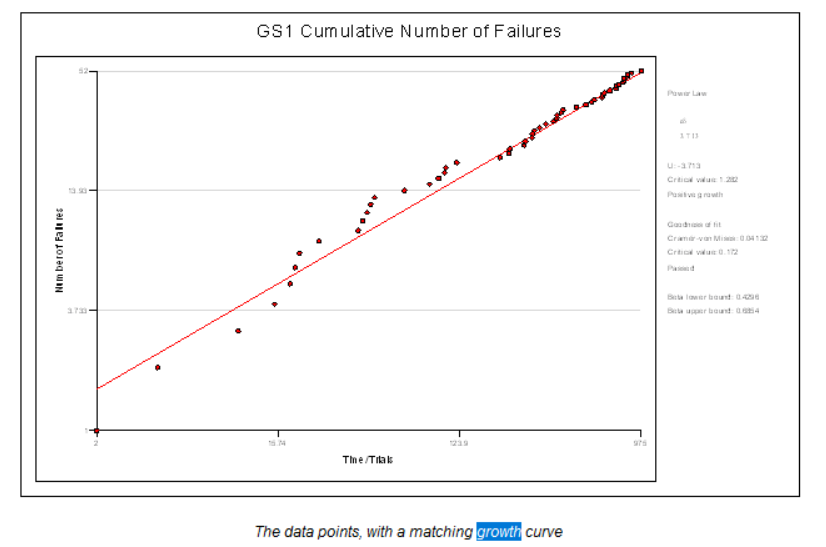
Reliability Growth
Introduction:
A product's (component, subsystem, or system) reliability metric (or parameter) can improve over time as a result of design and/or manufacturing process modifications. This is known as reliability growth.
A reliability growth program is a methodical approach of identifying reliability issues through testing, implementing remedial measures, and tracking the product's increased reliability over the course of the test phases.
The system, a significant subsystem, or a lower unit level can all be the site of reliability growth testing.
Therefore, The Reliability Growth module helps to determine there is an improving or worsening trend in reliability in a system.
Key distributions:
The Reliability Growth module can match a curve to continuous or discrete test times, based on one of the following methods:
- Power Law
- Power Law (grouped failures)
- Crow Discrete (Power Law for discrete data)
Benefits:
- It analyzes test data by calculating scale and shape parameters that define a growth curve that fits the data.
- The scale and shape parameters can be used to calculate failure intensity, Mean Time to Failure (MTTF), or Unreliability at an arbitrary time.
- This allows a user to determine there is an improving or worsening trend in reliability in a system.
- Reliability Workbench automatically fits a curve to the data according to the chosen method and displays the results graphically in the form of cumulative number of failures plots, failure intensity plots, MTTF plots, and Unreliability plot.
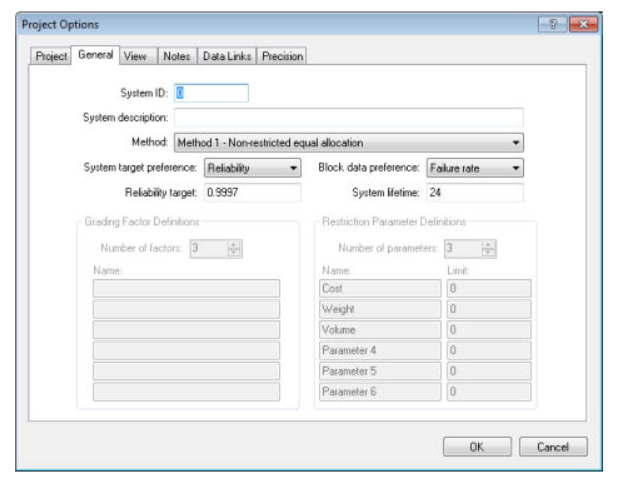
Reliability Allocation
Introduction:
- Reliability Allocation is a method of apportioning a system target reliability amongst sub-systems and components. It is a useful tool at design stage for determining the required reliability of equipment to achieve a given system reliability target.
Allocation Methods:
The Allocation module within Reliability Workbench supplies the user with six methods for assigning subsystem reliability values:
- Non-restricted equal allocation
- Non-restricted graded allocation
- Non-restricted proportional allocation
- Non-restricted redundancy proportional allocation
- Non-restricted reliability re-allocation
- Restricted direct research allocation
Benefits:
- Better allocation reliability values between the subsystems based on complexity, criticality, achievable reliability, or other factors that are deemed appropriate.
- Able to set reliability goals for individual subsystems till goal is met.
- Flexible import and export facilities
- Useful and customizable report designer for the generation of required templates of reports.
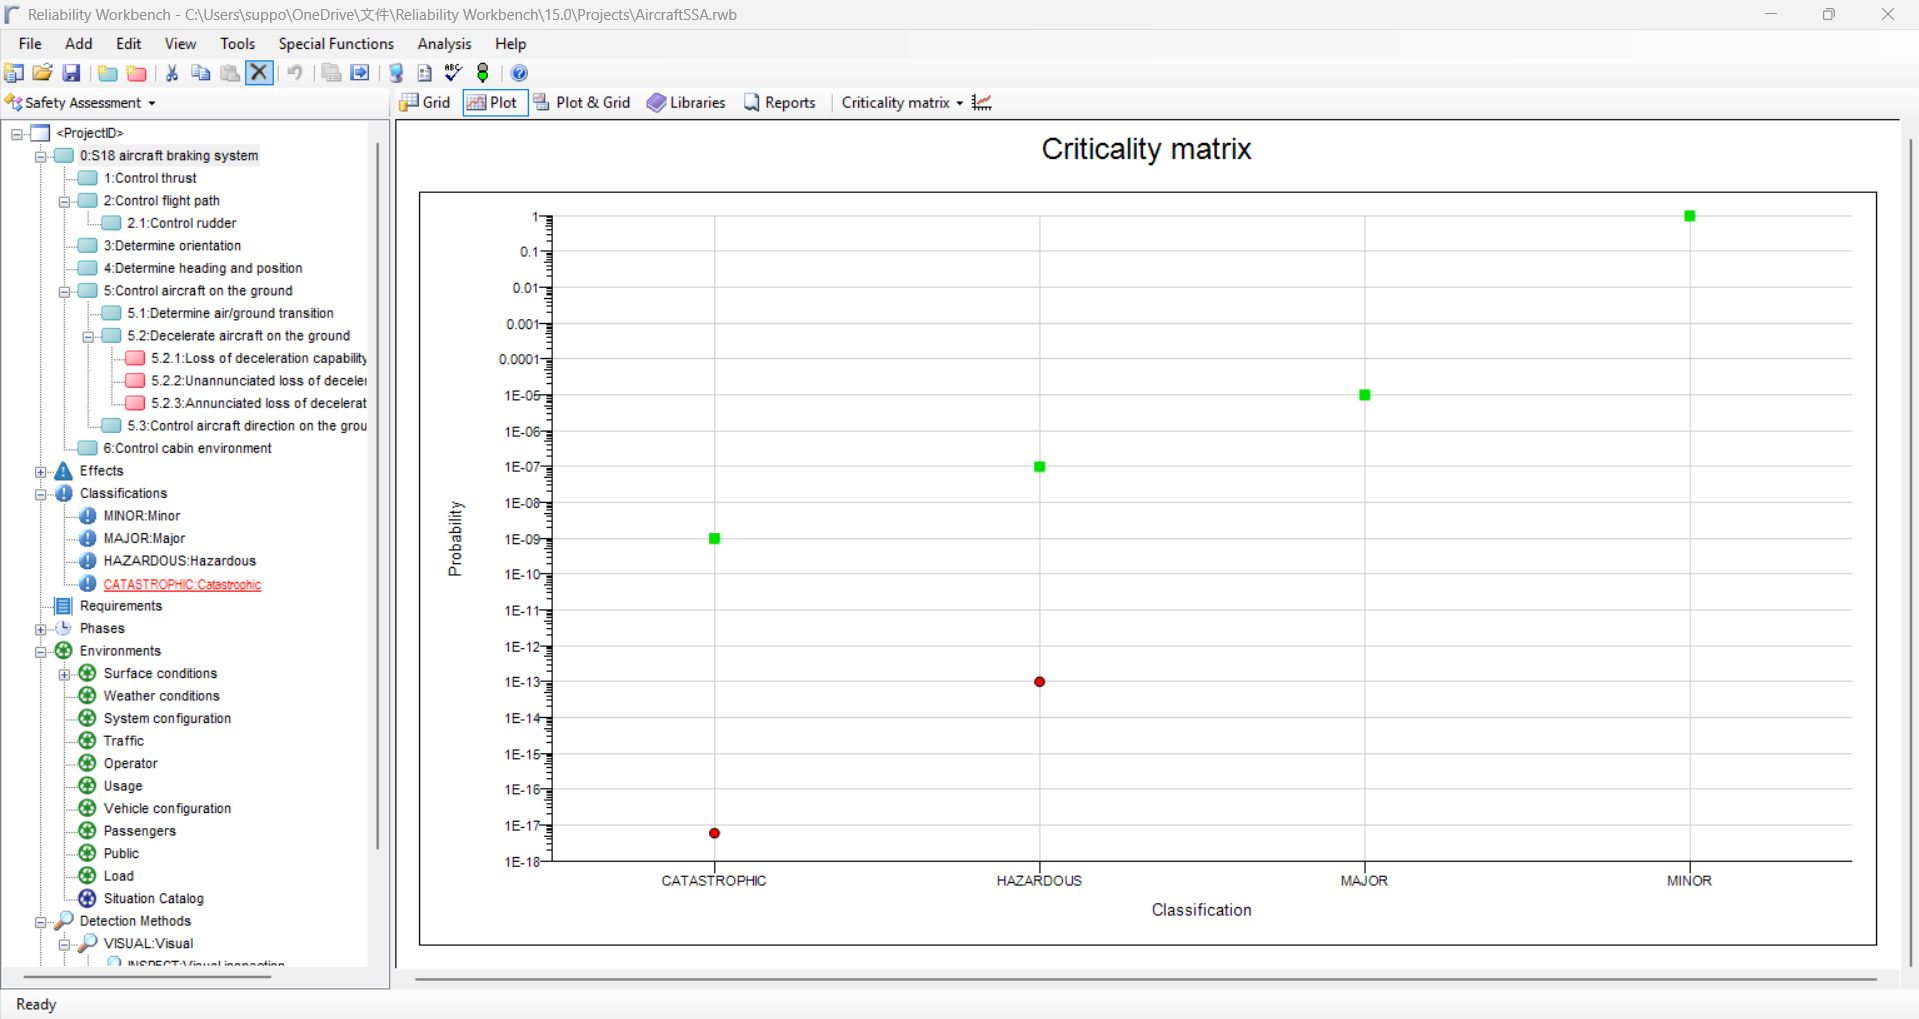
Safety Assessment
Introduction:
- A safety assessment is a systematic process used to evaluate potential risks and hazards in a given environment, system, process, or activity. The goal is to identify, analyze, and assess potential risks to ensure safety and prevent accidents or adverse events. Safety assessments are critical across a variety of fields, such as engineering, healthcare, environmental management, construction, and transportation, among others. The System Safety Assessment of the Reliability Workbench records the hazards and associated failures with the system and verifies whether the system safety requirements are met.
Key Features:
- The module links with other interfaces of the reliability workbench like Fault Tree, and FMECA for the safety assessment of the system.
- Identified failures are structured in hierarchical manner and classified according aerospace safety standards like ARP 4761 and ISO 26262.
Benefits:
- Both functional and preliminary safety assessments can be easily done.
- Customizable text fields allow projects to be configured according to customer requirements.
- Complex system can be easily assessed.
- Perform Functional Safety Assessments (FSA).
- Perform the Hazard identifications, risk analysis and risk evaluation
- Document compliance with safety regulations.
- Generate safety reports to demonstrate compliance to regulatory bodies.
- Flexible import and export facilities.
Useful and customizable report designer for the generation of required templates of reports.
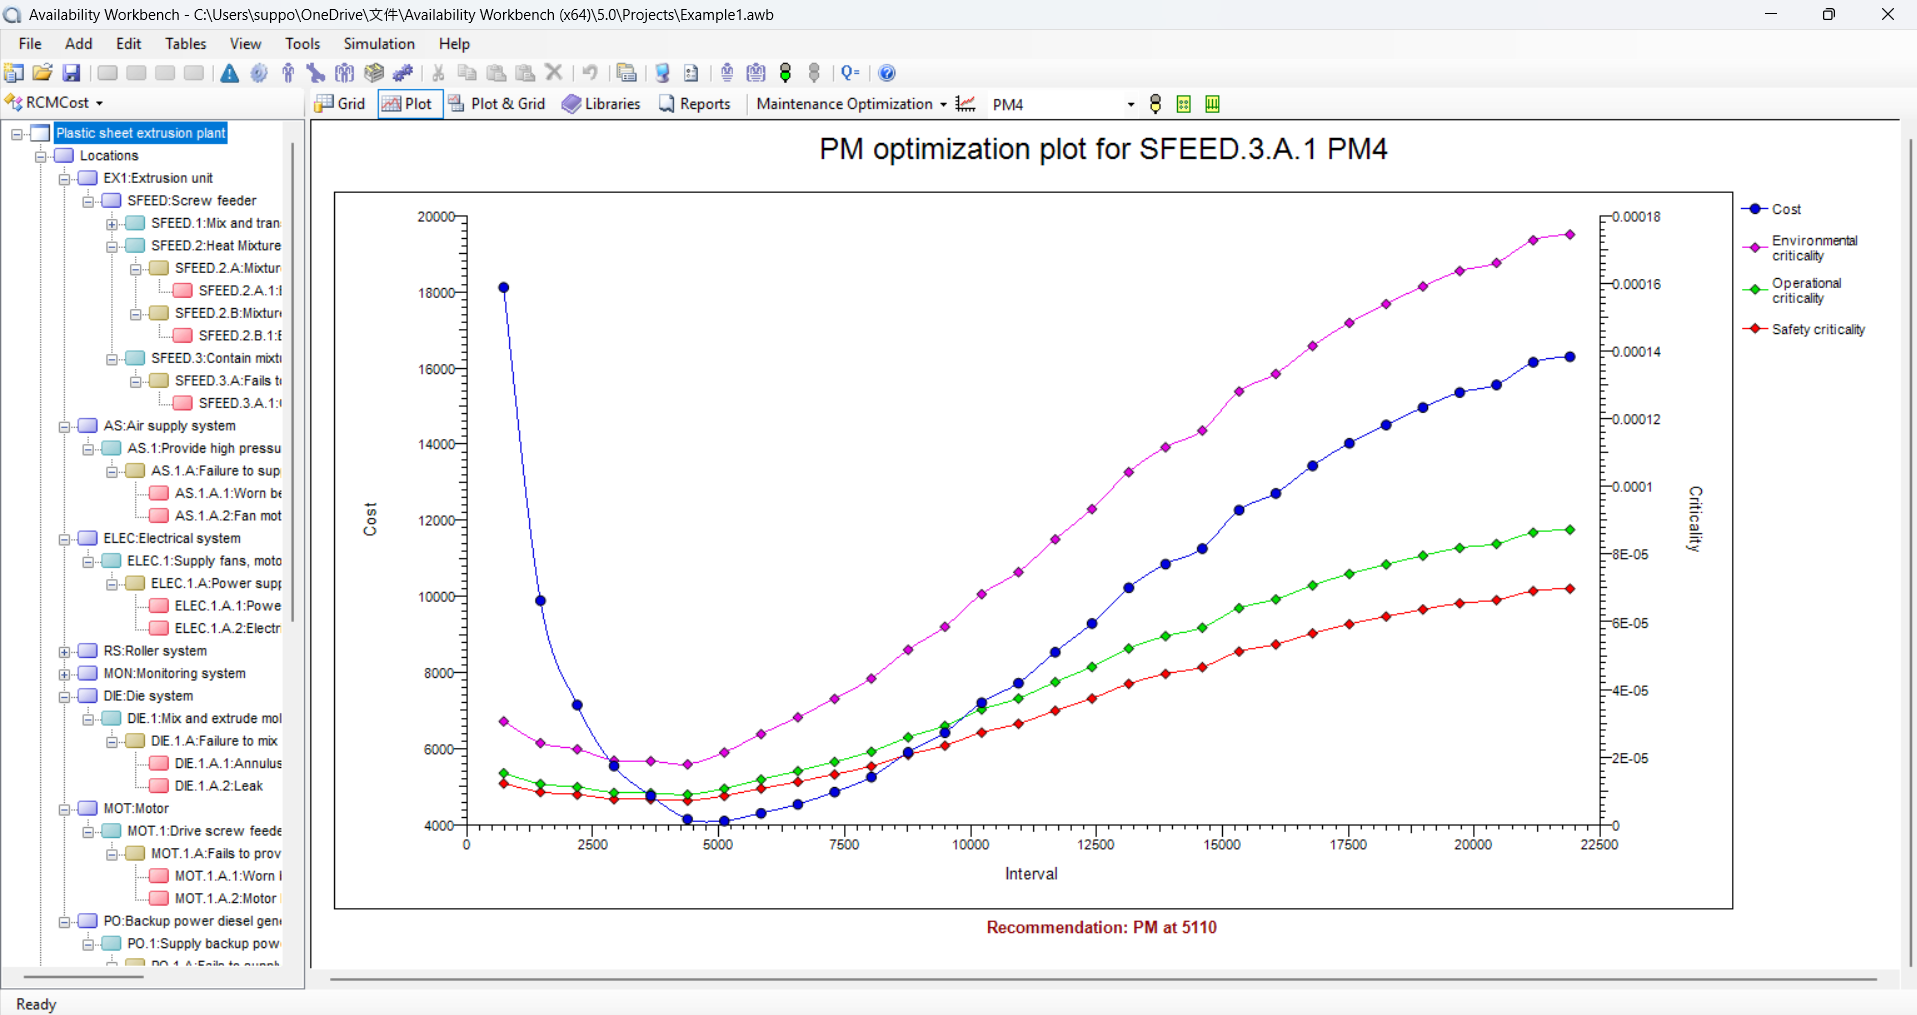
RCM Cost
Introduction:
- Reliability Centred Maintenance (RCM) Cost module of Availability Workbench provides and maintain the optimal maintenance strategies required for your reliability, cost, and safety aspects.
- This module helps to evaluate the life cycle costs of the system based on different scenario.
- It considers FMECA to identify the critical failures.
Key Features:
- Graphically constructed system hierarchy diagram using the adopted Failure Mode Effects and Criticality Analysis (FMECA) methodology
- Identification of critical failure modes and redundancy modelling facility.
- Able to do component and spare Importance ranking.
- Able to do the spare cost and interval Optimization
- Advice for decision making based on performance simulation using Monte Carlo simulation.
- Weibull analysis of field data and able to optimize plots for alternative maintenance strategies.
- BOM data can be used for RCM.
- RCM SAP® Portal, RCM MAXIMO® Portal, RCM ELLIPSE® Portal uses RCM Cost module for the analysis. These portals have RCM Cost module as link.
- These other maintenance strategies allowed are:
- Scheduled Preventive Maintenance Tasks (Lubrication or Replacement)
- Condition Monitoring Alarms
- On-Condition Inspections
- Inspections for Hidden Failures
- Re-Design
Benefits:
- The prime objectives of the maintenance program like minimizing costs, meeting Safety and Environmental goals and meeting Operational goals can be met easily.
- RCMCost module is the total cost of ownership which helps the management to take the decision on system design, maintenance policies and investments in reliability improvements.
- Using multiple maintenance strategies user can take powerful decisions.
- Multiple standards are used to design the system hierarchy and identify the failure modes.
- Maintenance and spare optimization can be easily done.
- Powerful plots are generated to take decisions for the best optimized strategies.
- Weibull module is also along with the RCM cost module enables the age of the products.
AvSim
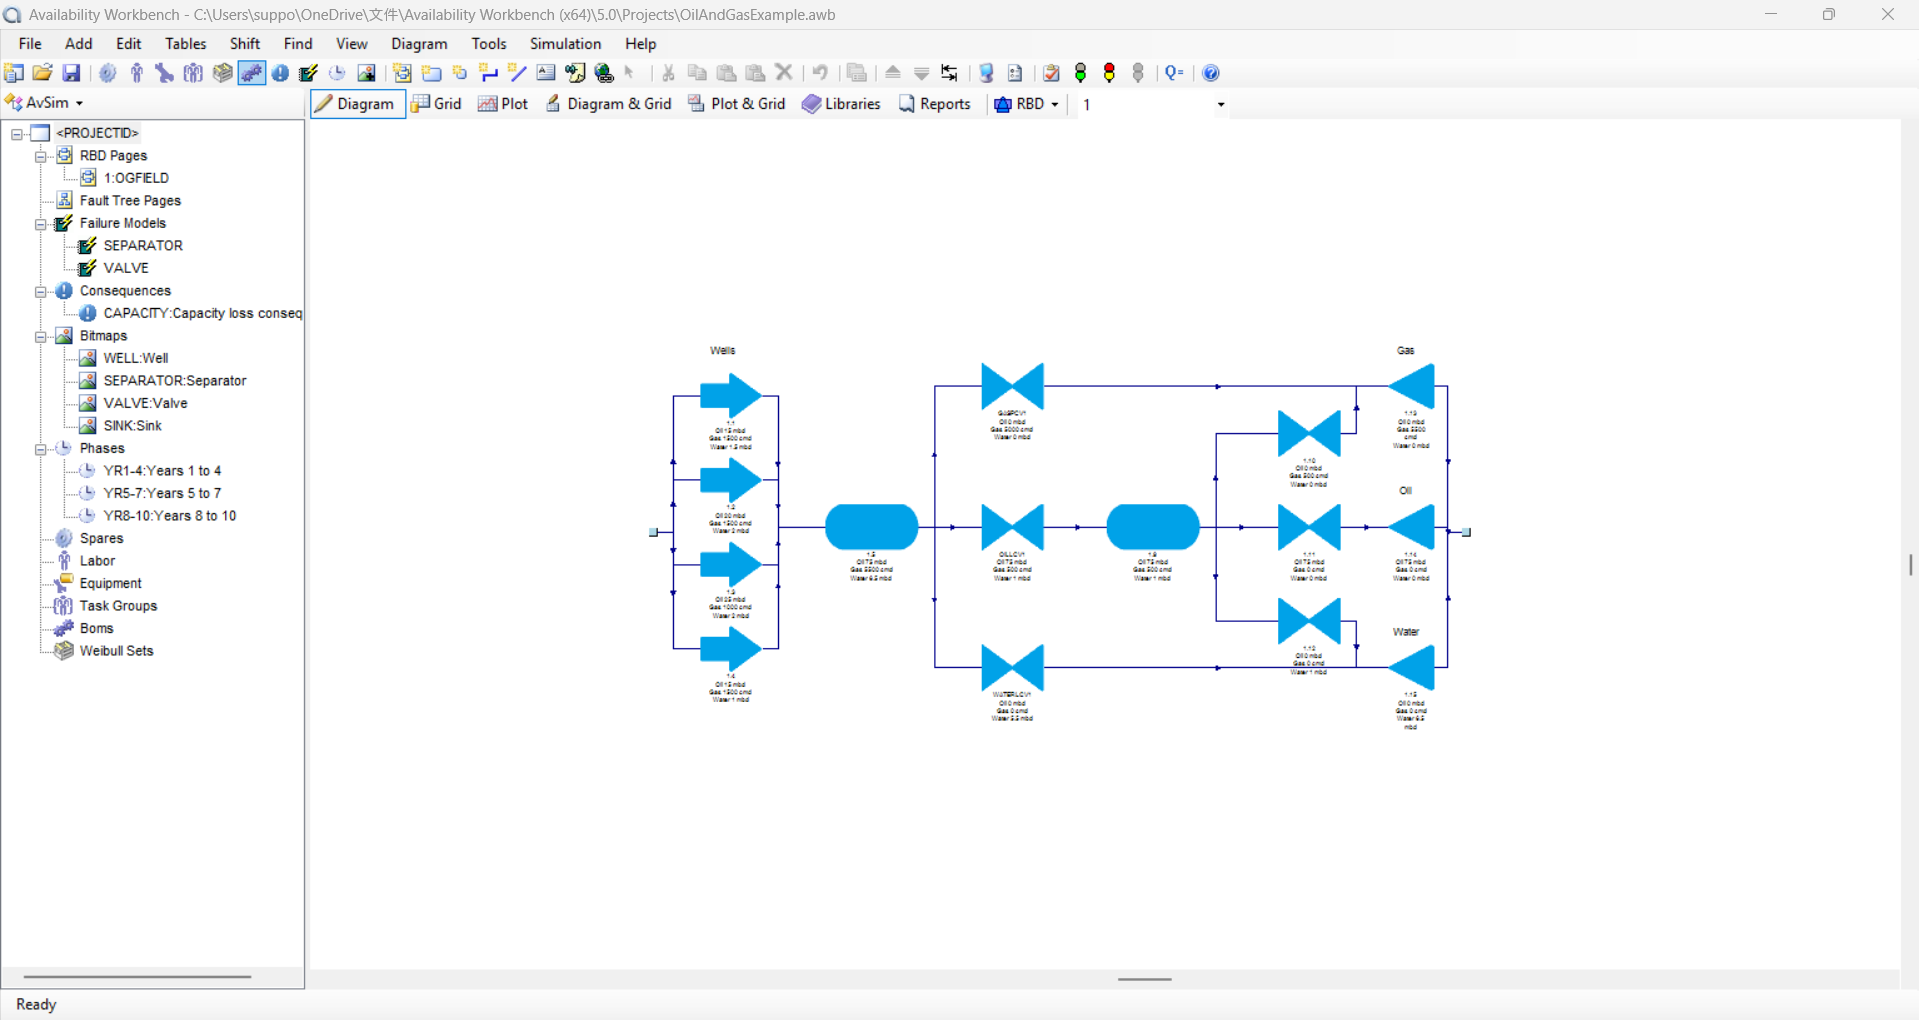
Introduction:
- Companies are very effectively using AvSim module for RAMS studies.
- Availability Simulation (AvSim) module of the Availability Workbench is the powerful system reliability and availability simulator.
- It inculcates the Fault Tree and RBD modules for the powerful graphics solution and optimizes the maintenance strategies.
- SAP data can be linked with AvSim module.
Key Features:
- Sub-system blocks allowing automatic Reliability Block Diagram (RBD) pagination
- AvSim can easily represents the large and complex system
- Simulation can be done using AvSim for system availability
- Pagination facilities for large fault trees and user control of scaling, shifting and gates, events selection.
- It can be simulated the repairable and non-repairable system
- Monte Carlo Simulation is used to simulate the AvSim for RAMS analysis.
- Simulation of production capacity levels with target cost penalties.
- Multiple-system spares tracking for fleet modelling and modelling of spares dependencies and stock levels and models recycling of spares via a repair shop
- Various failure models according to requirements are provided.
- Modelling of maintenance queuing and opportunistic maintenance and ‘hold for repair’ modelling
- Provide the maintenance strategies for different maintenance scenario.
- Able to do the scenario testing and sensitivity analysis to evaluate the system performance and identify the critical components or areas that most impact on system performance.
- Comprehensive reports interfacing with Microsoft Office products
- P-f curves for inspections and condition alarms
Benefits:
- The Availability Simulation module can help you optimize system availability and life-cycle costs by modelling:
- System availability and throughput
- Spares tracking and stock-outs
- Corrective maintenance
- Planned and predictive maintenance policies
- Switching delays and buffers
- Phased operations
- Standby systems
- Complex and dynamic systems can be easily designed and optimization of maintenance strategies
- It can effectively simulate the effects of different spares holding levels on lifetime costs.
- Multiple import and export facilities are available.
- Customizable reporting options make reports very accessible.
Weibull Pro
Introduction:
Weibull Pro analysis use to analyze the historical failure and repair data which produce the failure and repair characteristics of the failure mode.
Weibull Pro is provided as separate module as well as module integrated with Availability Workbench.
Key Distributions:
The following are the key distributions provided in the Weibull Pro:
- Exponential distribution
- 1-Parameter Weibull Distribution
- 2-Parameter Weibull Distribution
- 3-Parameter Weibull Distribution
- Bi-Weibull
- Tri-Weibull
- Lognormal Distribution
- Normal Distribution
- Weibayes
- Phased Bi-Weibull
- Phased Tri-Weibull
Benefits:
- It can inculcate the large group of data and complete the analysis quickly.
- Data can be entered manually or can be easily imported.
- It can automatically fit the selected distribution to the data.
- Able to display the results graphically in the form of cumulative probability plots, unconditional probability density plots and conditional probability density plots.
- Easily use this analysis for various other calculations in different modules like AvSim, RCM cost.
- Flexible import and export facilities are provided for easy convenience.
- Customizable reporting options make reports very accessible.
Life cycle Cost
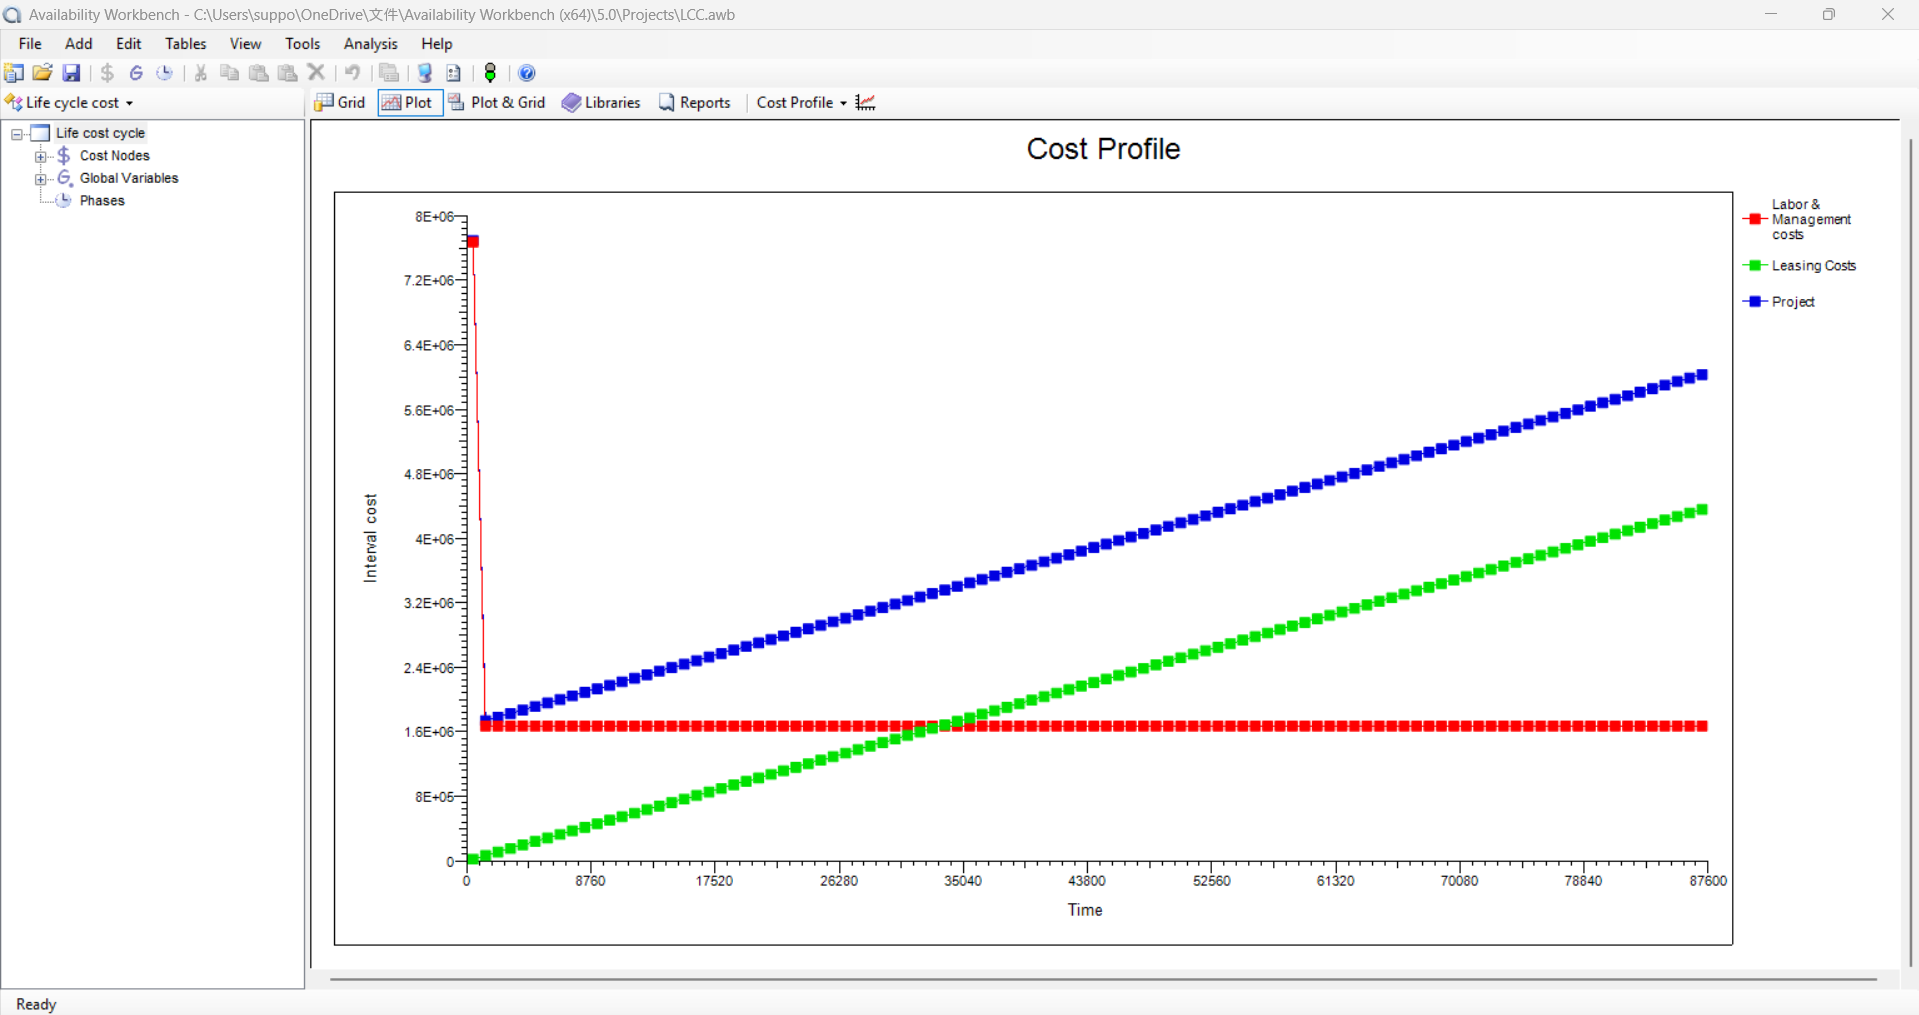
Introduction:
- The Life Cycle Cost Analysis module of Availability Workbench used for calculating the whole cost of a system from inception to disposal.
- It can be directly linked to RCM cost and AvSim modules.
Key Features:
- It allows the hierarchical cost break down structure through an unlimited number of indenture levels.
- Time- dependent costs can also be evaluated.
- Phase-dependent cost equations can be defined linking it with AvSim module.
- Multiple Import and export options are available.
- Customizable report designer for the easy report creation.
- Optimization can be done for maintenance intervals, replacement intervals, and spare parts inventory.
Benefits:
- LCC module allows users to define life cycle costs other than those predicted by the RCM Cost and AvSim modules.
- Multiple types of life cycle costs can be easily evaluated.
- The syntax of cost equations is easily understood.
- The construction of cost equations is assisted by an intelligent code-recognition utility that automatically reveals global variable lists as the user types in an equation.
- Customizable report designer to view and manage the reports.
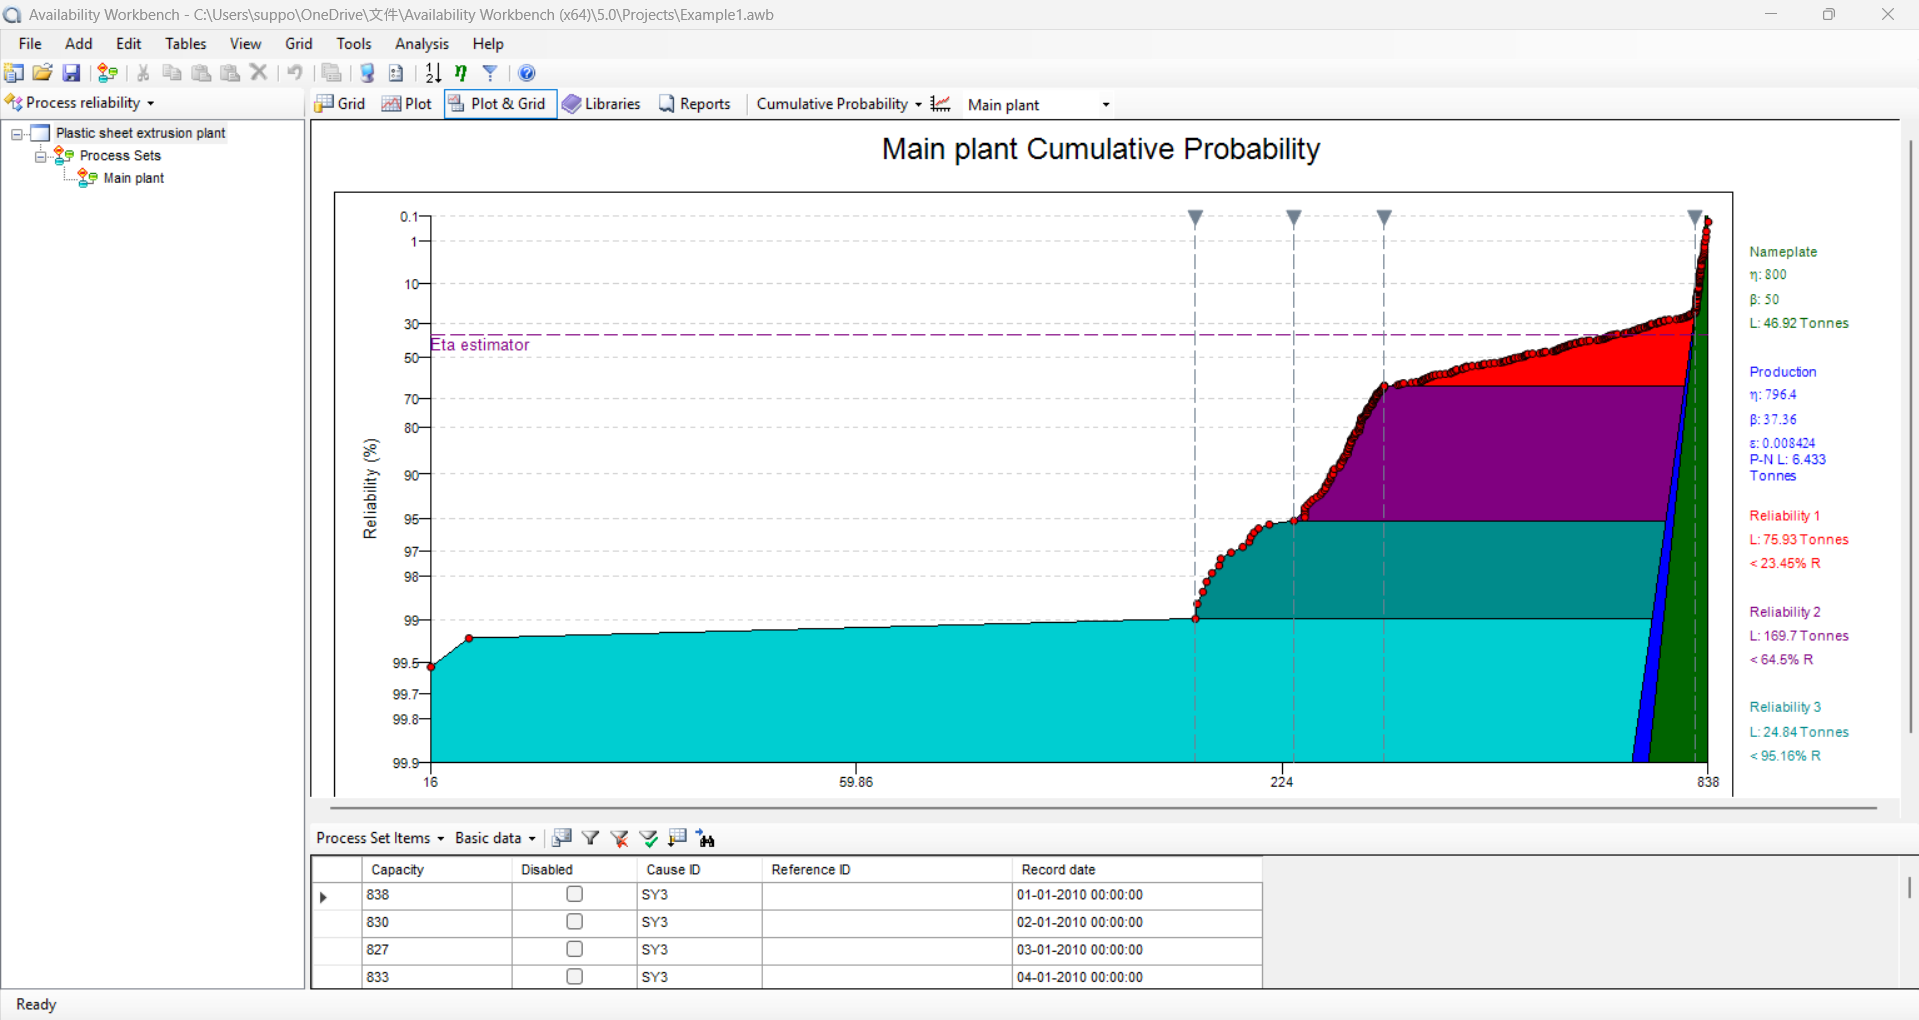
Process Reliability
Introduction:
Process Reliability of Availability Workbench identifies the systematic and reliability losses by recognizing trends in the production data using AvSim module and Weibull analysis modules.
Key Features:
- It allows production data to be compared from different plants or different time periods.
- Simulated production profiles can be created from the AvSim module.
- Potential plant improvements can be compared with existing production data easily.
- The Cumulative Probability plot, which is used to identify trends in the data are included.
- Multiple Import and export options are available.
- Customizable report designer for the easy report creation.
Benefits:
- Principal parameters are Actual Losses, Production Losses and Reliability Losses can be easily identified for corrective action.
- The Cumulative Probability plot are easily plotted to know the trends in the data.
- The Simulated data can be easily derived from AvSim module.
- Users can define a theoretical Nameplate Weibull distribution for convenience to plot the graphs
- Customizable report designer to view and manage the reports.
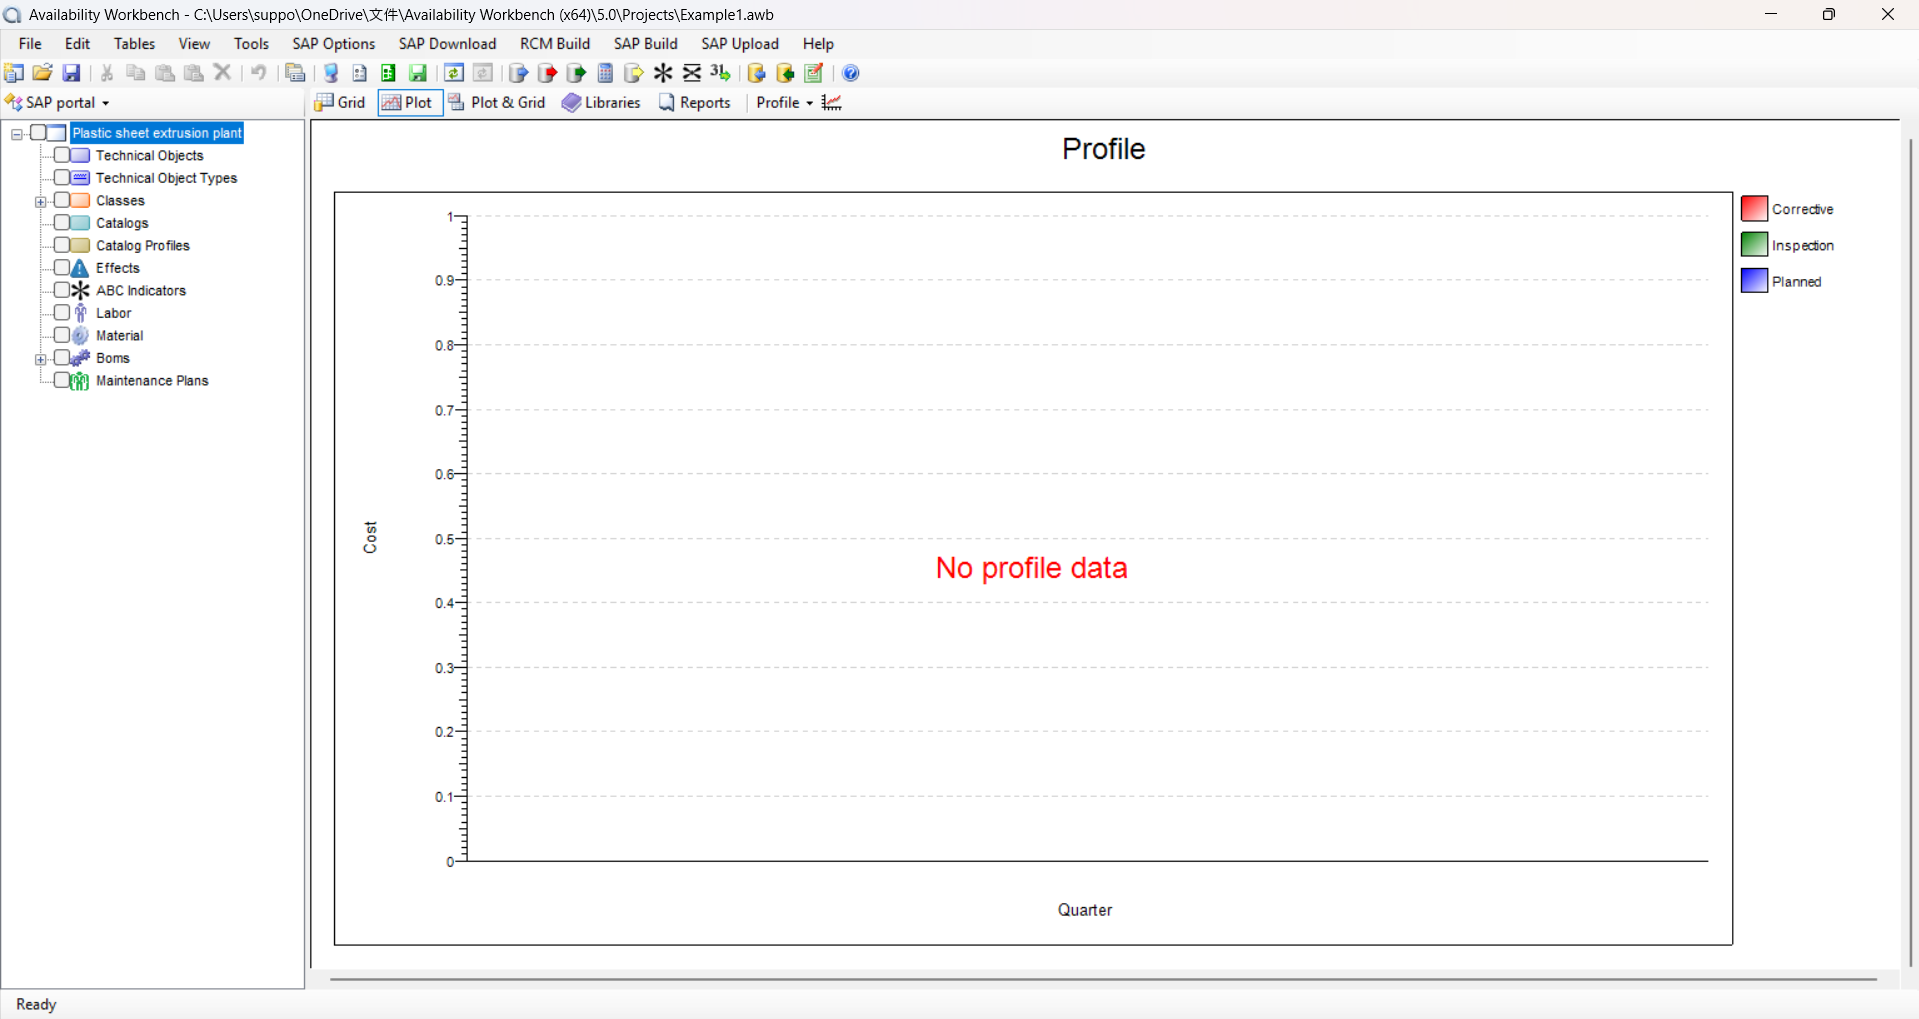
SAP Portal
Introduction:
Availability Workbench now allows you to download, analyze and configure SAP work notifications providing real failure data for use in your RCM optimization.
Key Features:
- Availability Workbench has SAP-certified integration with SAP ECC 6.0™
- Access to download and upload the master data from the respective software’s easily.
Benefits:
- Able to work offline after downloading data in the software.
- Active updating of maintenance plans into the software.
- Easy and fast access to the software.
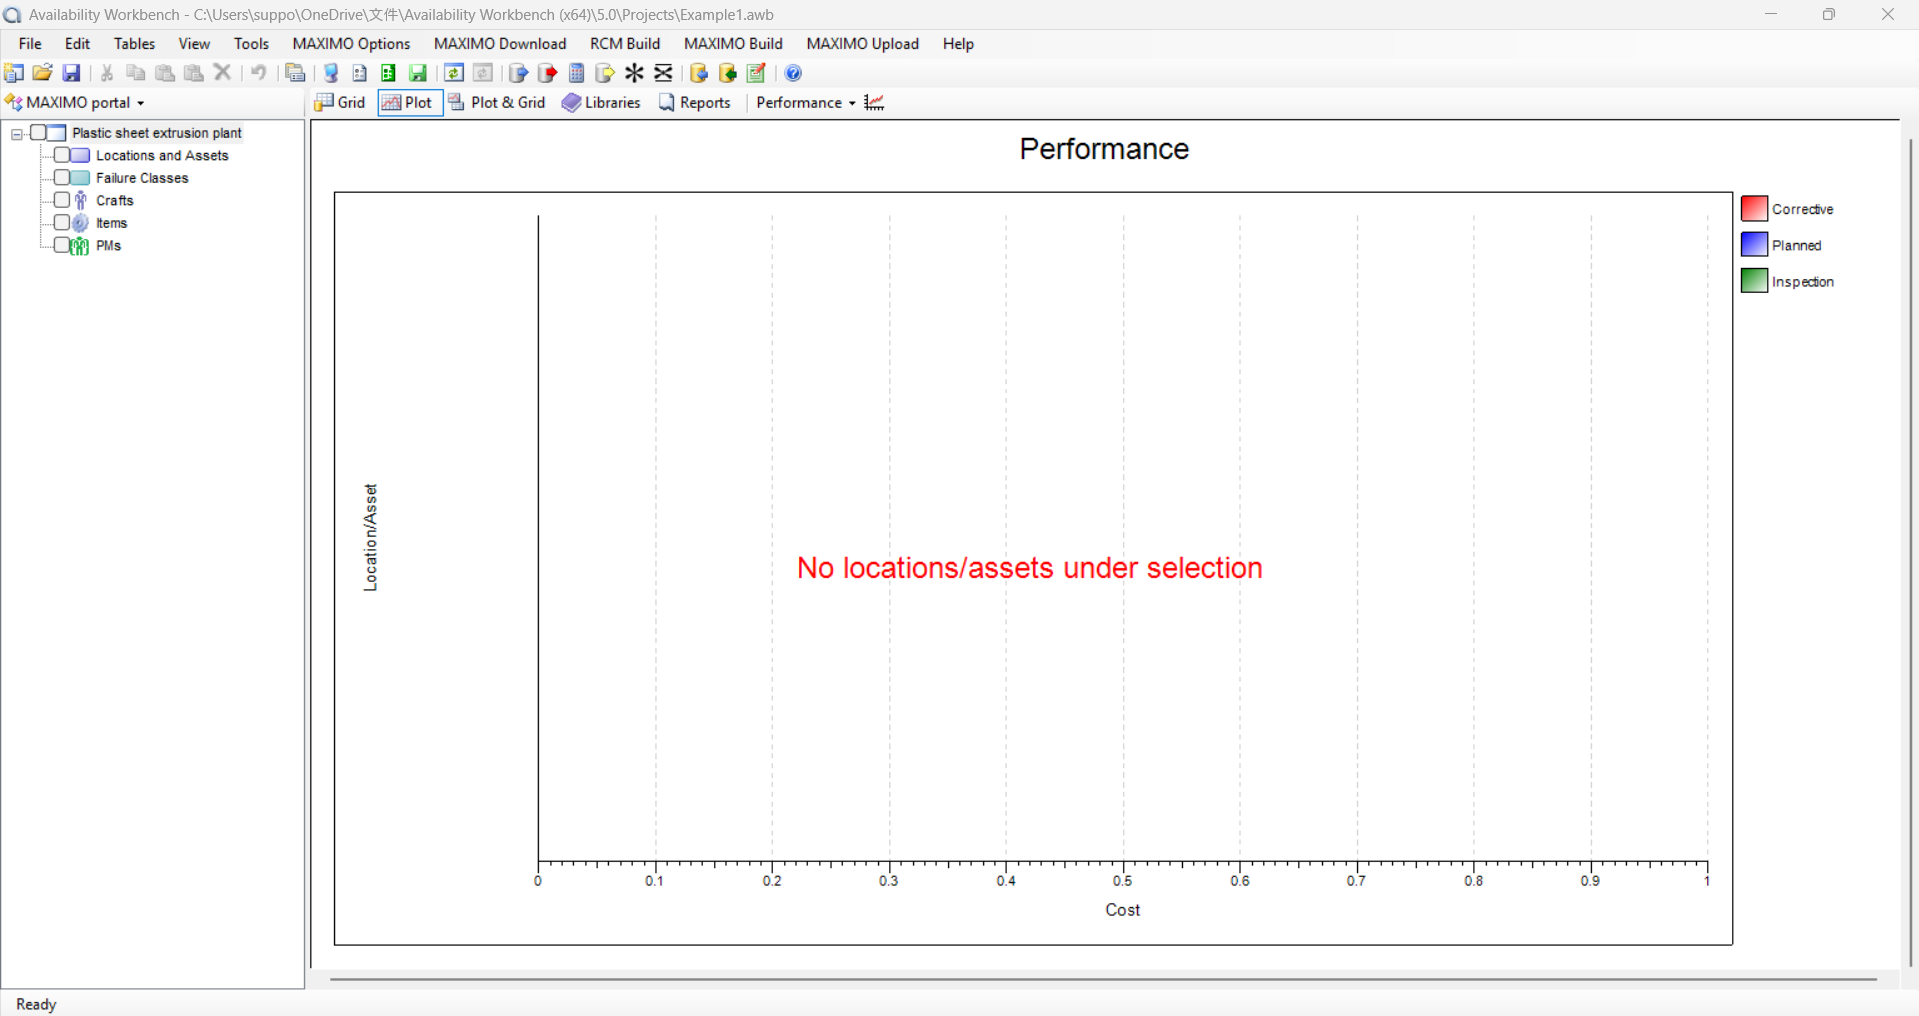
MAXIMO Portal
Introduction:
Availability Workbench now allows you to download, analyze and configure MAXIMO work notifications providing real failure data for use in your RCM optimization.
Key Features:
- Availability Workbench is an IBM “Ready for Tivoli” certified solution and MAXIMO is a registered trademark of IBM.
- Access to download and upload the master data from the respective software’s easily.
Benefits:
- Able to work offline after downloading data in the software.
- Active updating of maintenance plans into the software.
- Easy and fast access to the software.
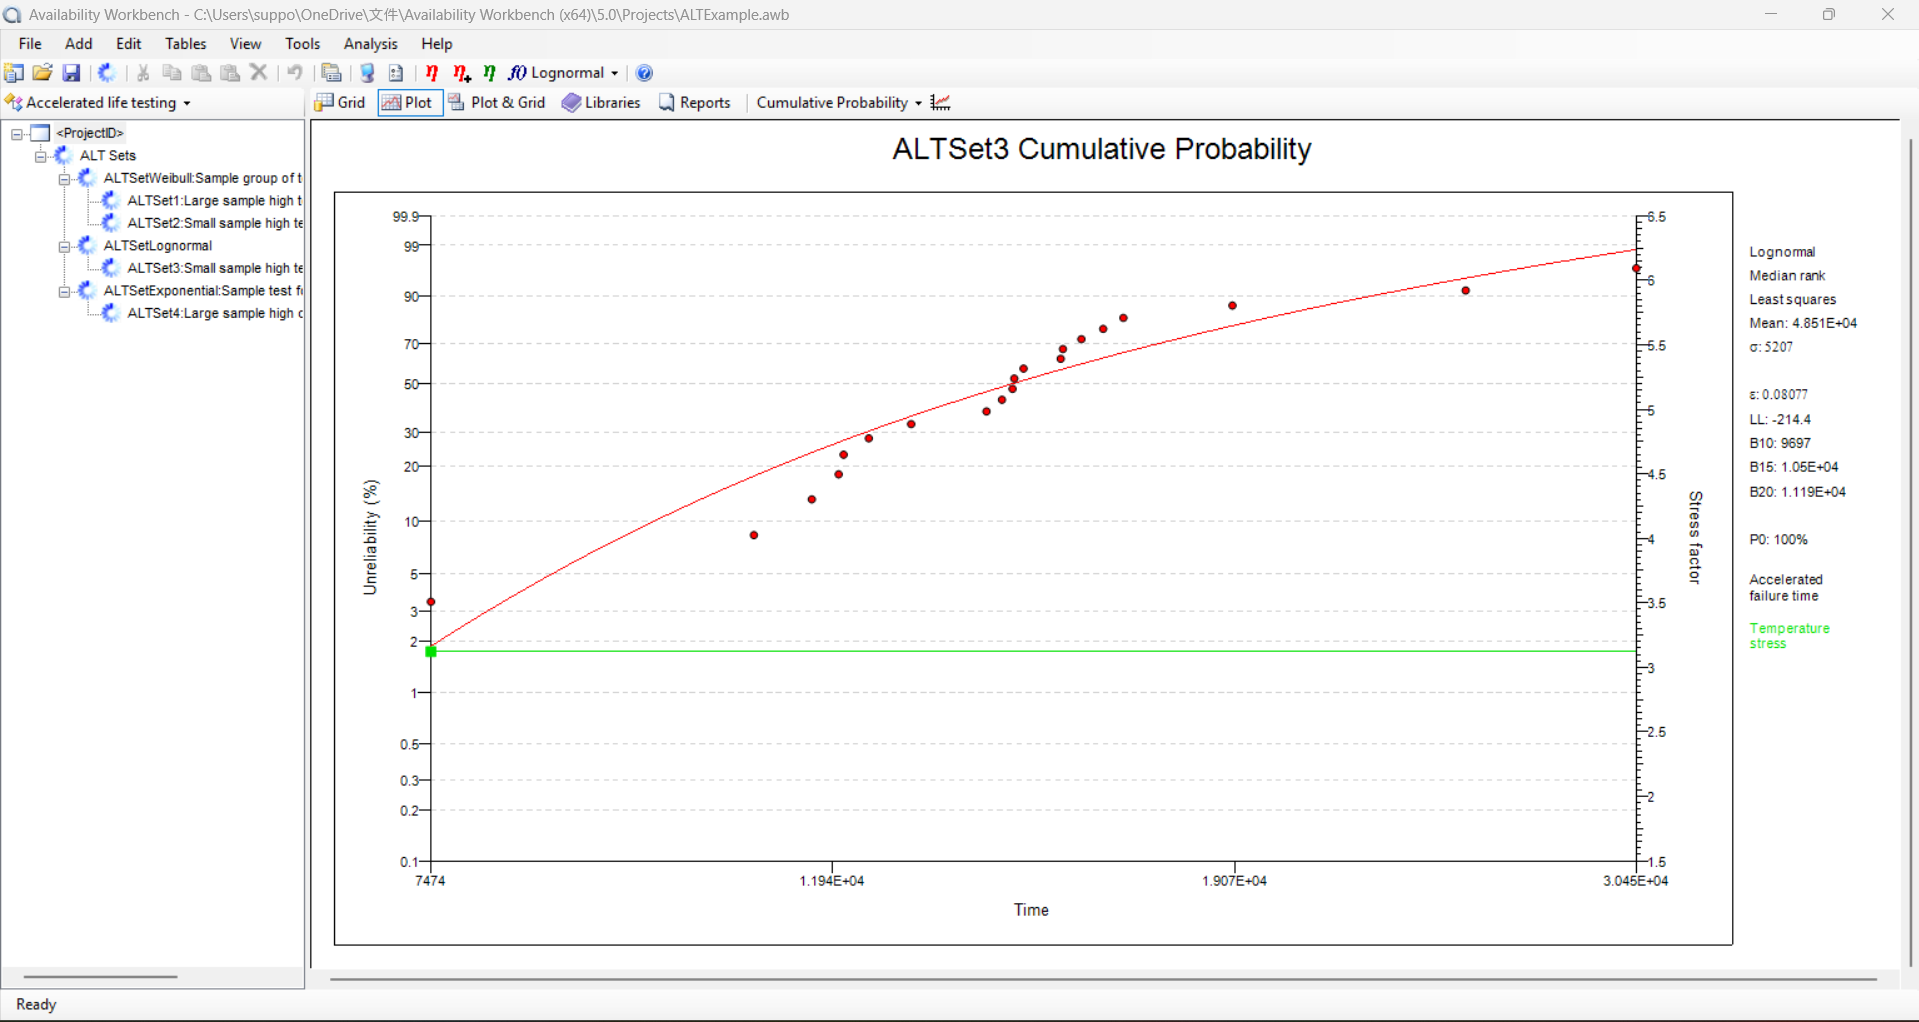
Accelerated Life Testing
Introduction:
The Accelerated Life Testing module provides the functionality to analyze accelerated failure data and predict reliability characteristics under normal use conditions.
Key Features:
- It allows data sets to be analyzed using a proportional hazards or accelerated failure time survival model.
- Standard stress profile models are provided together with the ability to define custom models.
- Constant, time-varying and multiple stress profiles may be specified for a single data set.
- Multiple Import and export options are available.
- Customizable report designer for the easy report creation.
Benefits:
- Easily evaluation of the data through Accelerated Life Testing module for the normal operating conditions.
- Custom models are provided to develop and evaluate the ALT data in different environmental conditions.
- Various stress profiles can be created for the data sets.
- Different stress profiles can be easily accessed.
- Customizable report designer to view and manage the reports.

1000
k
Happy Clients

150
k
Experts Staff

20
k
Win Awards